
2. Business Data Analytics Domains and Tasks
2.2 Source Data
Guide to Business Data Analytics
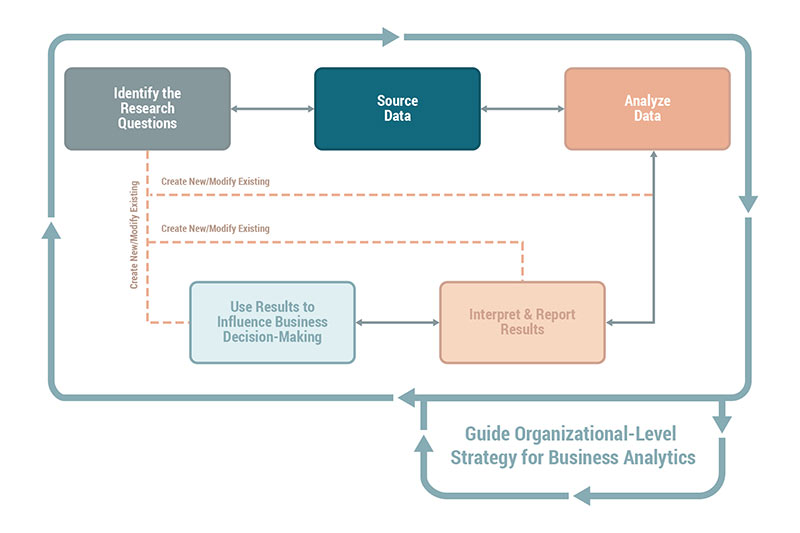
The tasks within the Source Data domain are performed by individuals who possess strong technical skills related to the data architecture of the organization and the skills required to extract or make the relevant data available from different data sources. While these tasks are critical and require the most amount of effort, the starting point of sourcing data is a top- down exercise. The first and foremost exercise in sourcing data is related to understanding the context of the problem and determining what type of data must be used.
The Source Data domain is a top- down exercise to determine the right data needed for a given research question.
In some organizations, this may be the task of a data analyst, data scientist, or a business analysis professional. While data scientists see datasets as a set of variables, it is the business analysis professional who brings the insight to determine whether a dataset might be useful to explore within a business context. Business analysis professionals understand the meaning behind data variables; in essence, the importance of the data to the organization. Because of these differences in viewpoints, a well-structured data analytics team includes professionals who collectively provide both business and data science skills when sourcing data.
Tasks in the Source Data domain include:
- Plan Data Collection,
- Determine the Data Sets,
- Collect Data, and
- Validate Data.
2.2.1 Plan Data Collection
Before data can be sourced, analysis is performed to determine what data is most relevant to the analytics problem. Analysts play a significant role in understanding and suggesting relevant data that may provide the expected outcome for the analytics problem before any significant data sourcing and mining activities can be performed. The data required may be internally available within the organization or may require external sources. In certain cases, active data collection may be required directly from the customers.
Some data may not be available due to privacy rules while other data may only be available during specific time frames. It requires choosing a representative group for data collection, designing surveys that will result in relevant data, embedding such surveys into business processes and workflows (for example, point-of-sale surveys).
When planning data collection, analyst consider:
Non-functional requirements are also considered when planning data collection. This includes privacy, security, retention, volume, timing, integration, and frequency requirements along with any constraints imposed by data availability and existing service level agreements.
Analysts look for situations where the data may have both short- and long- term effects on business decision-making and determine how this influences the frequency of data collection. When the frequency and timing needs for the business data analytics efforts are greater than what is currently happening, an assessment of costs to obtain the data at a more regular interval occurs.
Consideration is given to the level of effort required to obtain the data. Data sourced internally may be easier and cost less to obtain than data obtained from external sources. How much the data needs to be manipulated once obtained may influence sourcing decisions as well. For example, if there is a choice between obtaining data directly from a centrally managed data warehouse or pulling data from a peripheral secondary source where the data has already been manipulated into a more usable form, an assessment of data quality may be needed to help determine the best source. A direct pull of data and subsequent data manipulation may mean a little more work and overhead cost, but that might be acceptable if the post-massaged data from the secondary source is questionable from a quality perspective. Analysts also determine how much data will be structured versus unstructured and determine how much of each type is feasible to use.
Once a data collection plan is created, stakeholders who are impacted or possess some ownership over the data review the plan along with the analytics team. Analysts take responsibility for facilitating the team to consensus in order to obtain approval of the data collection approach.
When planning data collection, analysts use various elicitation techniques to acquire the information necessary to build the data collection plan. Brainstorming with the business and technical domain experts provides a quick list of data sources to consider. Document analysis is used to identify data sources through the review of existing architecture models. Skills such as organization and solution knowledge provide context and insights when developing a data collection approach. Problem-solving, identifying data sources, and decision-making are used when facilitating discussions with those who approve the data collection plan.
Before data can be sourced, analysis is performed to determine what data is most relevant to the analytics problem. Analysts play a significant role in understanding and suggesting relevant data that may provide the expected outcome for the analytics problem before any significant data sourcing and mining activities can be performed. The data required may be internally available within the organization or may require external sources. In certain cases, active data collection may be required directly from the customers.
Some data may not be available due to privacy rules while other data may only be available during specific time frames. It requires choosing a representative group for data collection, designing surveys that will result in relevant data, embedding such surveys into business processes and workflows (for example, point-of-sale surveys).
When planning data collection, analyst consider:
- what data is needed,
- the availability of the data,
- the need for historical data,
- determining when and how the data will be collected, and
- how the data will be validated once collected.
Non-functional requirements are also considered when planning data collection. This includes privacy, security, retention, volume, timing, integration, and frequency requirements along with any constraints imposed by data availability and existing service level agreements.
Analysts look for situations where the data may have both short- and long- term effects on business decision-making and determine how this influences the frequency of data collection. When the frequency and timing needs for the business data analytics efforts are greater than what is currently happening, an assessment of costs to obtain the data at a more regular interval occurs.
Consideration is given to the level of effort required to obtain the data. Data sourced internally may be easier and cost less to obtain than data obtained from external sources. How much the data needs to be manipulated once obtained may influence sourcing decisions as well. For example, if there is a choice between obtaining data directly from a centrally managed data warehouse or pulling data from a peripheral secondary source where the data has already been manipulated into a more usable form, an assessment of data quality may be needed to help determine the best source. A direct pull of data and subsequent data manipulation may mean a little more work and overhead cost, but that might be acceptable if the post-massaged data from the secondary source is questionable from a quality perspective. Analysts also determine how much data will be structured versus unstructured and determine how much of each type is feasible to use.
- Structured data is data that is organized, well-thought-out and formatted, such as data residing in a database management system (DBMS). Structured data is easily accessed by initiating a query in a query language such as SQL (standard query language).
- Unstructured data is the exact opposite of structured data as it exists outside of any organized repository like a database. Unstructured data takes on many forms and sources such as text from word processing documents, emails, social media sites, image, audio, or video files.
Once a data collection plan is created, stakeholders who are impacted or possess some ownership over the data review the plan along with the analytics team. Analysts take responsibility for facilitating the team to consensus in order to obtain approval of the data collection approach.
When planning data collection, analysts use various elicitation techniques to acquire the information necessary to build the data collection plan. Brainstorming with the business and technical domain experts provides a quick list of data sources to consider. Document analysis is used to identify data sources through the review of existing architecture models. Skills such as organization and solution knowledge provide context and insights when developing a data collection approach. Problem-solving, identifying data sources, and decision-making are used when facilitating discussions with those who approve the data collection plan.
| Importance of Industry Knowledge in Sourcing Data Customer insolvency is one of the big concerns in subscriber-based business models. For instance, in telecom a timely and accurate identification of customers who do not pay their bills can result in significant savings. One approach to identifying data for such a scenario can be to look at customer behaviour towards past payments. However, an analyst with sufficient industry knowledge may recommend call detail records (CDR) to be considered as an additional data requirement. CDR consists of call transactions and identifiers of each call that originates from a given mobile number. For example, CDR may assist in determining a trend in call volumes for a particular account. Likewise, analysts may suggest investigating customer profile data to identify new customers. There is a higher percentage of new customers who do not pay than existing customers. Geo-location data gathered from mobile devices and cell tower data can also be considered to understand if a mobile phone is dormant over a period. CDR, customer profile data, geo- location, and cell tower data can be used to strengthen the insights that may not be achieved by simply investigating past payment data. Identification of the right data that may be useful for a given analytics problem is heavily influenced by the industry knowledge available to the analytics team. An analyst may use multiple techniques such as process analysis, concept modelling, and discovery workshops to uncover the business context to determine the type of data needed. |
2.2.2 Determine the Data Sets
Determining data sets involves performing a review of the data expected from the data sources and determining specifics such as data types, data dimensions, sample size, and relationships between different data elements. It involves deciding which whole, and which partial, datasets need to be collected. For example, determining whether to use an entire spreadsheet versus specific rows within it. When the required data is not available, determining data sets also involves identifying data gaps. Data gaps occur when data doesn't exist or is missing due to errors such as a failure in the data collection process.
Analysts collate and assess data by establishing relationships between different data elements and identifying data linkages between data from various sources. They may use data discovery tools or database querying to assess data availability.
A five Vs assessment (volume, velocity, variety, veracity, value) helps to determine which datasets to consider:
Analysts possess a firm understanding of the lexicon used by the different business units and are capable of drawing comparisons and relationships between different data sets having the same meaning. Analysts also possess strong visualization skills and contribute to creating conceptual architectural diagrams that depict the data sources, data flows, and frequency of the data feeds. Such models are essential when facilitating discussions about data sourcing with stakeholders and facilitating approvals.
Analysts support data scientists by analyzing the cost versus benefits of different data sets. It is ideal for the analytics team to collect their own data from scratch to reduce any external biases during data collection, but frequently there are not enough resources to do so. Analysts advise on the advantages and disadvantages of using different data sets from a cost, value, timing, risk, and feasibility perspective. This is especially important when the data needed for analytics must be acquired from an external third party. Certain research questions may need to be dropped when it is determined too expensive to obtain the data required to answer it.
When determining data sets, analysts use a variety of techniques to help them work with and understand the data before building their analytical models. Data profiling is used to assess the content, structure, and quality of data. Data sampling is used when breaking a large source of data into a smaller, more manageable set of data. Sampling helps an analyst reduce the amount of data they have to work with as it provides a means to use a representative subset of the larger population. Skills such as creative thinking and conceptual thinking are useful when formulating ideas about which data to use. Business acumen helps the analyst determine which data sets may be best to use based on the current business situation.
Determining data sets involves performing a review of the data expected from the data sources and determining specifics such as data types, data dimensions, sample size, and relationships between different data elements. It involves deciding which whole, and which partial, datasets need to be collected. For example, determining whether to use an entire spreadsheet versus specific rows within it. When the required data is not available, determining data sets also involves identifying data gaps. Data gaps occur when data doesn't exist or is missing due to errors such as a failure in the data collection process.
Analysts collate and assess data by establishing relationships between different data elements and identifying data linkages between data from various sources. They may use data discovery tools or database querying to assess data availability.
A five Vs assessment (volume, velocity, variety, veracity, value) helps to determine which datasets to consider:
- Volume: is determined by the amount of data being produced and the size of the data sets needing to be processed.
- Velocity: is determined by the speed at which data is generated and the frequency by which the data needs to be collected and processed.
- Variety: is determined by the variety of data sources, formats, and types needing to be processed.
- Veracity: refers to the trustworthiness of the data and that which presents uncertainties and inconsistencies in the data.
- Value: refers to the necessity of driving any analytics exercise from real, valuable business goals.
Analysts possess a firm understanding of the lexicon used by the different business units and are capable of drawing comparisons and relationships between different data sets having the same meaning. Analysts also possess strong visualization skills and contribute to creating conceptual architectural diagrams that depict the data sources, data flows, and frequency of the data feeds. Such models are essential when facilitating discussions about data sourcing with stakeholders and facilitating approvals.
Analysts support data scientists by analyzing the cost versus benefits of different data sets. It is ideal for the analytics team to collect their own data from scratch to reduce any external biases during data collection, but frequently there are not enough resources to do so. Analysts advise on the advantages and disadvantages of using different data sets from a cost, value, timing, risk, and feasibility perspective. This is especially important when the data needed for analytics must be acquired from an external third party. Certain research questions may need to be dropped when it is determined too expensive to obtain the data required to answer it.
When determining data sets, analysts use a variety of techniques to help them work with and understand the data before building their analytical models. Data profiling is used to assess the content, structure, and quality of data. Data sampling is used when breaking a large source of data into a smaller, more manageable set of data. Sampling helps an analyst reduce the amount of data they have to work with as it provides a means to use a representative subset of the larger population. Skills such as creative thinking and conceptual thinking are useful when formulating ideas about which data to use. Business acumen helps the analyst determine which data sets may be best to use based on the current business situation.
2.2.3 Collect Data
Collecting data involves the activities performed to support data professionals with data setup, preparation, and collection. The degree of involvement analysts have with data collection depends on how the organization structures the analytics team as well as the technical abilities of analysts.
In a broad sense, there are two approaches to data collection:
The file format for the output produced from each source is also identified. Further analysis determines if the data needs to be formatted prior to merging it into a single file. For example, will spaces need to be removed when moving data from a text file to a spreadsheet? Will data formats need to change so data is consistent between sources? There are instances where data discrepancies cannot be programmatically identified. These require domain knowledge to interpret the same type of data with different labels with the same meaning in different data sources. As data is collected, it is analyzed to identify potential problems with the data collection approach.
When collecting data, analysts leverage techniques such as surveys and experiments. Data collection is usually performed using automated tools over business processes. Data analysis skills determine what data to use, how to collect it, and its relevance and relationship to what is being analyzed. Demonstrating skills such as trustworthiness and ethics helps to build trust and rapport with stakeholders who may be needed to gain access to data or participate in elicitation activities. Business acumen is necessary during the testing of the data approach and when profiling data.
Collecting data involves the activities performed to support data professionals with data setup, preparation, and collection. The degree of involvement analysts have with data collection depends on how the organization structures the analytics team as well as the technical abilities of analysts.
In a broad sense, there are two approaches to data collection:
- Passive Data Collection: unobtrusive data collection from users in their day-to-day transactions with the organization. This type of data is available without an analytics objective in mind, and a large portion of such data may already exist with the organization. For example, point-of- sale data, internet browsers, web, and mobile data. This type of data is often curated or transformed to be used for research questions.
- Active Data Collection: actively seeking information from stakeholders for a specific goal. This type of data is not readily available with the organization (surveys and self-reports). Analysts play a significant role in structuring and applying best practices to design the data collection initiative. For example, the analyst may use best practices to design a survey on how to formulate open or closed-ended questions, use of a rating scale like the Likert scale, paired-comparisons, the number of questions, and the flow of questions.
- determine if the data will be originated from different sources,
- identify where the data is going to be collected from (for example, database, spreadsheet, other sources), and
- understand where the data comes from, what transformations are performed, and where it is finally stored in order to assess data quality. This is referred to as data lineage.
The file format for the output produced from each source is also identified. Further analysis determines if the data needs to be formatted prior to merging it into a single file. For example, will spaces need to be removed when moving data from a text file to a spreadsheet? Will data formats need to change so data is consistent between sources? There are instances where data discrepancies cannot be programmatically identified. These require domain knowledge to interpret the same type of data with different labels with the same meaning in different data sources. As data is collected, it is analyzed to identify potential problems with the data collection approach.
When collecting data, analysts leverage techniques such as surveys and experiments. Data collection is usually performed using automated tools over business processes. Data analysis skills determine what data to use, how to collect it, and its relevance and relationship to what is being analyzed. Demonstrating skills such as trustworthiness and ethics helps to build trust and rapport with stakeholders who may be needed to gain access to data or participate in elicitation activities. Business acumen is necessary during the testing of the data approach and when profiling data.
2.2.4 Validate Data
Validating data involves assessing that the planned data sources can and should be used and, when accessed, the data obtained are providing the types of results expected. Since a detailed analysis of the data is yet to be performed, the objective of validation at this point is high-level.
Business validation involves having the business stakeholders approve the data sources and establish the acceptance criteria that define the parameters for assessing the accuracy of the data. It also includes validating any relevant requirements. For example, if the outcome of data analysis is expected to be a report, business validation involves validating the format and data elements to be included in the report. Technical validation involves technical testing and validation to assess data quality. There are several characteristics reflected in high-quality data, such as:
When validating data, analysts use techniques such as data mapping and business rules analysis. Data mapping is used to create a source-to-target data map to define the mapping between the data sources being used and the target system. Business rules analysis provides an understanding of the business rules governing the data by providing guidance as to what should be validated. Conceptual thinking skills help make sense out of the large sets of disparate data sources under analysis and to draw relationships and understanding from the data. Business knowledge provides context to the data being validated, helping analysts determine if the data is accurate and complete.
Validating data involves assessing that the planned data sources can and should be used and, when accessed, the data obtained are providing the types of results expected. Since a detailed analysis of the data is yet to be performed, the objective of validation at this point is high-level.
Business validation involves having the business stakeholders approve the data sources and establish the acceptance criteria that define the parameters for assessing the accuracy of the data. It also includes validating any relevant requirements. For example, if the outcome of data analysis is expected to be a report, business validation involves validating the format and data elements to be included in the report. Technical validation involves technical testing and validation to assess data quality. There are several characteristics reflected in high-quality data, such as:
- Accuracy: the data is correct and represents what was intended by the source. Accurate data is not misleading. Accuracy might be assessed by comparing numbers displayed by a front-end system with data retrieved from the database.
- Completeness: the data is comprehensive and includes what is expected and nothing is missing. Completeness might be assessed by ensuring required fields do not include null values.
- Consistency: how reliable the data is. Data values are consistent when the value of a data element is the same across sources. Consistency might be assessed by ensuring only date values are being displayed in date fields.
- Uniqueness: data that is unique is valuable to an organization. Uniqueness might be assessed by determining whether any duplicates exist in the data.
- Timeliness: data that is fresh and current is more valuable than data that is out of date. Timeliness might be assessed by determining whether the data being received is for the period being requested.
When validating data, analysts use techniques such as data mapping and business rules analysis. Data mapping is used to create a source-to-target data map to define the mapping between the data sources being used and the target system. Business rules analysis provides an understanding of the business rules governing the data by providing guidance as to what should be validated. Conceptual thinking skills help make sense out of the large sets of disparate data sources under analysis and to draw relationships and understanding from the data. Business knowledge provides context to the data being validated, helping analysts determine if the data is accurate and complete.
2.2.5 Select Techniques for Source Data
The following is a selection of some commonly used analysis and analytics techniques applicable to the Source Data domain. The list of techniques presented does not represent a comprehensive set of techniques used by an analyst in the Source Data domain but presents a small, but useful, set of techniques that can be used.
The following is a selection of some commonly used analysis and analytics techniques applicable to the Source Data domain. The list of techniques presented does not represent a comprehensive set of techniques used by an analyst in the Source Data domain but presents a small, but useful, set of techniques that can be used.
| Techniques | Usage Context for Business Data Analytics | BABOK® Guide v3.0 Reference |
| Acceptance and Evaluation Criteria | Used for determining the correct data and to validate data by understanding applicable criteria from both business and technology perspectives so that the right data can be sourced. | Chapter 10.1 |
| Data Dictionary | Used to create a dictionary of terminologies to describe the data labels that can be applied consistently to prepare datasets which can be used throughout the life cycle of an analytics initiative. | Chapter 10.12 |
| Data Flow Diagrams | Used to understand the conceptual or logical view of the data being collected and stored within data sources used for planning and data validation. | Chapter 10.13 |
| Data Modelling | Used to organize data elements and their interrelationships in conceptual, logical, and physical form in order to identify and validate the right data sources. | Chapter 10.15 |
| Document Analysis | Used to gather information about various internal source systems. | Chapter 10.18 |
| Interface Analysis | Used to understand how data is captured and stored in relevant data sources. Such analysis is useful in cases where an interface may request multiple data elements but stores information differently. | Chapter 10.24 |
| Non-Functional Requirements Analysis | Used for identifying and analyzing quality and governance attributes such as privacy, volume, frequency, retention, integrity, and constraints related to data sources to formulate a data collection plan. | Chapter 10.30 |
| Survey or Questionnaire | Used as a form of actively collecting data which may not be available readily but may be required for the analytics initiative. | Chapter 10.45 |
| Data Mapping | Used to develop traceability between data elements and data sources with the data owner, availability, frequency, constraints, assumptions, transformations, and extraction/ collection methods to build a reference for data collection. | N/A |
| ETL and Data Management Techniques | Used to extract and curate required data without compromising or changing data that is needed for ongoing business operations. | N/A |
2.2.6 A Case Study for Source Data
Voice termination fraud is a major concern in the telecom industry; billions of dollars are lost by telecom companies according to industry research.
.1 The Challenge
Voice termination fraud, also referred to as SIMbox fraud, often occurs when international calls are hijacked by an intermediate network party and the call traffic is routed via Voice over Internet Protocol (VoIP) and then injected back through SIMboxes that are local to the receiving country. These practices effectively bypass the fees owed to telecom carriers resulting in lost revenue for the telecom industry.
Consider Alice in Country A who is making a phone call to Bob in Country B (a different country), as depicted in the graphic below. Instead of the call moving through the legal least cost path between the two countries, it moves through a SIMbox to a fraudulent least cost path carrier.
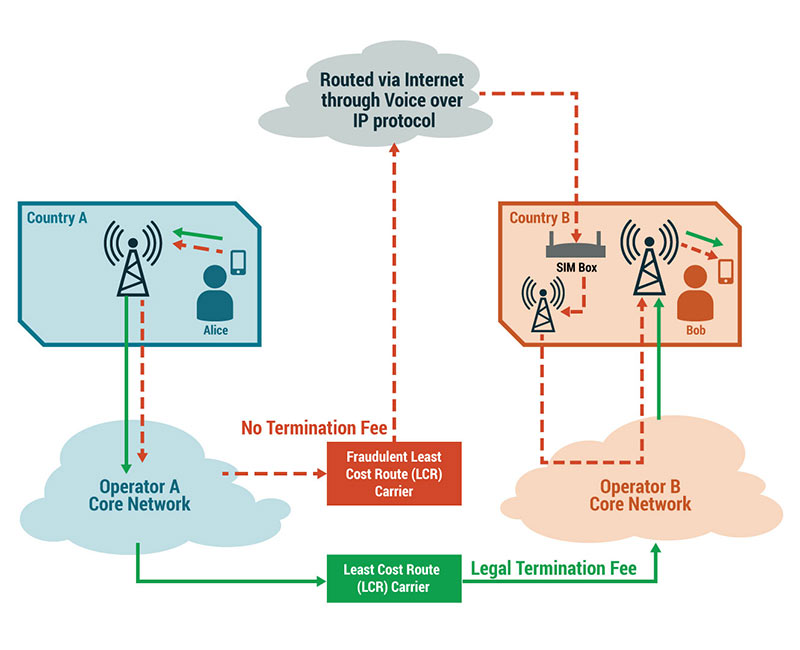
A SIMbox is a legal device, but they can be used by individuals to re-route cell phone calls to VoIP, in order to bypass the receiving network carrier, who would have received a termination fee for providing the last mile connectivity for calls. This reduces the money collected and overall revenues of the telecom as well as voice quality and fidelity of the networks.
Context
Traditional detection methods are inaccurate when detecting SIMbox fraud. SIMbox network signatures are difficult to track and emulate genuine devices like network repeaters or probes. Plus, the volume of device data generated is extremely large in size and variety.
This is especially a problem in Africa and Southeast Asia as the local call rates are cheaper compared to global averages. A Nigerian telecom carrier plans to use recent advancements in predictive analytics to detect and limit voice termination frauds in real-time. Adaku Musa, an experienced telecom expert with the telecom carrier, was asked to assist the data analysis team in her organization to develop a solution that could predict real-time fraudulent traffic in the network.
.2 Identifying Options
As an experienced telecom expert, Adaku was well aware of recent technological advancements. She assessed the situation and recommended three methods to support the objectives of this work:
.3 Outcomes Achieved
It is important to note that each method builds on the previous analysis in an iterative manner and provides an escalation in approach and successively more accurate information. The data itself goes through several layers of transformation. Business data analytics tools and techniques, as well as strong business knowledge, were used throughout to identify the actual predictors and rules that would be useful for predicting fraud.
The following identifies the results of the analysis and lists the data that was used to determine the appropriate predictors for fraud analysis:
In this case, the data identified in the first table was directly available. Using domain knowledge and successive data transformation approaches, the data depicted in the second table was created to support the predictive analytics outcomes. This data improves the predictive power of any SIMbox fraud detection algorithm.
By progressing through this structured approach, analyzing the data, and utilizing appropriate business data analytics techniques, Adaku could determine the best set of predictors that her organization could use to develop the fraud classification algorithm.
.4 Key Takeaways
Voice termination fraud is a major concern in the telecom industry; billions of dollars are lost by telecom companies according to industry research.
.1 The Challenge
Voice termination fraud, also referred to as SIMbox fraud, often occurs when international calls are hijacked by an intermediate network party and the call traffic is routed via Voice over Internet Protocol (VoIP) and then injected back through SIMboxes that are local to the receiving country. These practices effectively bypass the fees owed to telecom carriers resulting in lost revenue for the telecom industry.
Consider Alice in Country A who is making a phone call to Bob in Country B (a different country), as depicted in the graphic below. Instead of the call moving through the legal least cost path between the two countries, it moves through a SIMbox to a fraudulent least cost path carrier.
A SIMbox is a legal device, but they can be used by individuals to re-route cell phone calls to VoIP, in order to bypass the receiving network carrier, who would have received a termination fee for providing the last mile connectivity for calls. This reduces the money collected and overall revenues of the telecom as well as voice quality and fidelity of the networks.
Context
Traditional detection methods are inaccurate when detecting SIMbox fraud. SIMbox network signatures are difficult to track and emulate genuine devices like network repeaters or probes. Plus, the volume of device data generated is extremely large in size and variety.
This is especially a problem in Africa and Southeast Asia as the local call rates are cheaper compared to global averages. A Nigerian telecom carrier plans to use recent advancements in predictive analytics to detect and limit voice termination frauds in real-time. Adaku Musa, an experienced telecom expert with the telecom carrier, was asked to assist the data analysis team in her organization to develop a solution that could predict real-time fraudulent traffic in the network.
.2 Identifying Options
As an experienced telecom expert, Adaku was well aware of recent technological advancements. She assessed the situation and recommended three methods to support the objectives of this work:
| Analysis Steps | Explanation | Advantages | Disadvantages |
| Identify SIMbox characteristics | Place test calls to own network from a foreign country through a calling card and identify if the last leg of a call is routed through SIM cards. This can be used to discover rules to identify SIMboxes and apply these rules in data collection and transformation in more sophisticated analysis. |
Easy to apply for discovering SIMbox characteristics/rules. For example:
|
|
| Passive call detail records (CDR) analysis with data sampling | Analyze CDR to create a baseline for relevant data that may be used for predicting/classifying a call, whether it is genuine or not. The rules discovered in the earlier stage are used to derive the right predictors and formats. For example, CDR may provide individual call duration, but volume of outgoing call for a SIM/subscriber is an aggregate level data, which may be a true predictor. |
|
|
| Analysis of CDR utilizing big data technologies | Analyze CDR using different big data technologies to discover additional predictor variables that may affect the classification of fraud. This step could have been performed before sampling in the previous step; however, it would have taken more time, effort, and cost to do so. |
|
|
.3 Outcomes Achieved
It is important to note that each method builds on the previous analysis in an iterative manner and provides an escalation in approach and successively more accurate information. The data itself goes through several layers of transformation. Business data analytics tools and techniques, as well as strong business knowledge, were used throughout to identify the actual predictors and rules that would be useful for predicting fraud.
The following identifies the results of the analysis and lists the data that was used to determine the appropriate predictors for fraud analysis:
| CDR Information Directly Available | Transformed Information used for Prediction |
| Partial CDR Fields (Call Level) | Description | Transformed Data (SIM Level) |
Description |
| Time | Date and time of the call | IMSI | International mobile subscriber’s ID |
| Duration | Call duration | Total # Calls/ day | Total number of calls per day |
| Originating Number | Caller's number | Total numbers called | Total number of unique subscribers called on a single day |
| Originating Country Code | Caller's country identifier | Total Night Calls | Total number of night-time calls |
| Terminating Number | Receiver's number | Total Incoming | Total number of incoming calls to the subscriber |
| Terminating Country Code | Receiver's country code | Average Minutes | Average call duration of each subscriber |
| IMEI | International mobile equipment ID | Most Frequent LAC ID | Most frequent base station used for calls |
| IMSI | International mobile subscriber's ID | Most frequent Originating Country | Most frequent originating country identifier |
| LAC ID | Local area base station identifier | Most frequent Terminating Country | Most frequent terminating country identifier |
In this case, the data identified in the first table was directly available. Using domain knowledge and successive data transformation approaches, the data depicted in the second table was created to support the predictive analytics outcomes. This data improves the predictive power of any SIMbox fraud detection algorithm.
By progressing through this structured approach, analyzing the data, and utilizing appropriate business data analytics techniques, Adaku could determine the best set of predictors that her organization could use to develop the fraud classification algorithm.
.4 Key Takeaways
- A structured approach to planning data collection and how that data can be used results in more accurate analysis and subsequent prediction of fraud.
- Industry knowledge, business knowledge, and solution knowledge are key competencies to help identify the most relevant data. In this case, Adaku's knowledge of how SIMbox fraud takes place pointed her to the CDR as the right data source.
- The available data may not be directly useful in analysis and undergoes additional transformation to serve its intended use. In this case, the data captured in the CDR was not sufficient in its raw form and application of business knowledge was needed to transform the data to a more business-oriented format for better analytical insights.
- By successive experimentations and analysis of the outcomes, more accurate methods might emerge. In this case, we saw the refinement of data and methods (rule-based discovery to passive CDR analysis to real- time big data implementation) to achieve the desired outcomes.