
2. Business Data Analytics Domains and Tasks
2.5 Use Results to Influence Business Decision-Making
Guide to Business Data Analytics
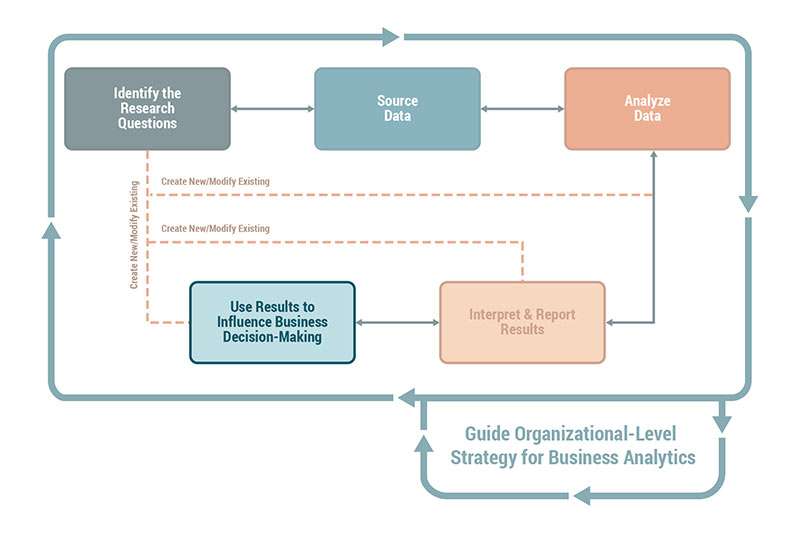
The Use Results to Influence Business Decision-Making domain involves using the analytics results to enable decision-making that generates value for the organization. Standalone reports and analytics results are useful only when some action is taken based on the insights that address the business problems or opportunities. Analytics results can be used as a strategic asset to influence the business model and processes. These results can be used as decision support or by integrating into workflows to provide real-time decisions. For example, they can provide product recommendations in e- commerce, automated underwriting, fraud detection, and automated portfolio re-balancing in financial sectors.
Analysts translate the analytics outcomes to business recommendations that the stakeholders and decision-makers can consume. Analysts may be further required to develop a strategy on how the analytics results can be best used. Any business action that is influenced by the result of analytics initiative may result in an organizational change that affects people, process, offerings, or technology. This resulting change needs to be managed, and analysts are well suited for developing a plan that outlines how the transition can occur from the current state to a future state.
Tasks in the Use Results to Influence Business Decision-Making domain include:
- Recommend Actions,
- Develop Implementation Plan, and
- Manage Change.
2.5.1 Recommend Actions
Before an analyst can recommend changes to address the business need, an evaluation is conducted to determine the success of the analysis. Did the outcome of the analytics answer the research question? How well did the analysis address the business need?
The activities performed within the six domains of business data analytics are iterative. When the outcome is not what was expected, or if the data does not deliver the kind of insights required and there is no feasible solution that has been ascertained to address the business need, the business data analytics cycle is repeated, starting with the formation of a new research question.
If the analysis was enough to provide valuable insights to drive business change, the effort switches to using the results to drive conversations about how the changes will be made and implemented. These possibilities are referred to as solution options. Solution options proposed may include elements of the process, tool, resource, or IT system changes.
Analysts elicit the types of solution options the business might consider in addressing the business need, rating and ranking the options, and proposing a recommendation to the decision-makers based on the analysis and insights gleaned from the analytics efforts.
Business analysis professionals are skilled at identifying solutions that:
Changes resulting from a business data analytics initiative are prioritized, funded, and initiated like other change proposals within the organization. Analysts play an important role in explaining the options and initiating the work required to move forward on making the recommended changes.
When recommending solution options, analysts use financial analysis techniques to determine the potential value of the various options. Focus groups are used to obtain feedback from participants with regards to the options under consideration. Other types of models, whether they are depicting processes, scope, or various elements of the organization, are used when making a recommendation or explaining a solution. Creative thinking, problem-solving, and systems and conceptual thinking are all skills used by analysts when recommending actions.
Before an analyst can recommend changes to address the business need, an evaluation is conducted to determine the success of the analysis. Did the outcome of the analytics answer the research question? How well did the analysis address the business need?
The activities performed within the six domains of business data analytics are iterative. When the outcome is not what was expected, or if the data does not deliver the kind of insights required and there is no feasible solution that has been ascertained to address the business need, the business data analytics cycle is repeated, starting with the formation of a new research question.
If the analysis was enough to provide valuable insights to drive business change, the effort switches to using the results to drive conversations about how the changes will be made and implemented. These possibilities are referred to as solution options. Solution options proposed may include elements of the process, tool, resource, or IT system changes.
Analysts elicit the types of solution options the business might consider in addressing the business need, rating and ranking the options, and proposing a recommendation to the decision-makers based on the analysis and insights gleaned from the analytics efforts.
Business analysis professionals are skilled at identifying solutions that:
- align to the strategic direction of the organization,
- are valuable,
- provide a return for the needed investment, and
- address stated KPIs.
Changes resulting from a business data analytics initiative are prioritized, funded, and initiated like other change proposals within the organization. Analysts play an important role in explaining the options and initiating the work required to move forward on making the recommended changes.
When recommending solution options, analysts use financial analysis techniques to determine the potential value of the various options. Focus groups are used to obtain feedback from participants with regards to the options under consideration. Other types of models, whether they are depicting processes, scope, or various elements of the organization, are used when making a recommendation or explaining a solution. Creative thinking, problem-solving, and systems and conceptual thinking are all skills used by analysts when recommending actions.
| Example of Integrating Predictive Analytics Results to Business Workflow A large e-commerce retailer updates the pricing of their products dynamically. Customer experience and trust are significant equity for any large-scale retailer. With millions of pricing updates taking place in the e-commerce platform for millions of products, any pricing anomalies can result in loss of customers. Anomaly detection algorithms that can mitigate the issue in real-time can be a true game-changer. This type of algorithm can work on various types of data such as competitor prices, historical product prices, delivery cost, in-store prices, and discounts to arrive at estimated product prices that can then be used as a reference to detect anomalous pricing. An analytics initiative can detect anomalous pricing of the product in order to identify pricing deviations that result from incorrect data input. Consider a predictive analytics proof of concept to detect pricing anomalies with a mix of models, for example, Gaussian Naïve Bayes, autoencoders, gradient boost, and random forest. The evaluation criterion is the F1 score, which minimizes both false positive and false negatives simultaneously. The performance of this combination could satisfactorily classify a pricing update as an anomaly or not, with acceptable results for use by business stakeholders. The proof of concept uses static data from various data sources to produce the results. In this scenario the analytics solution was very technical. Business analysis professionals require understanding the technical aspects at just enough depth to assess the solution against business needs. More importantly, a business analysis professional performs additional analysis to determine whether the analytics solution can be integrated with the current processes. Analytics results alone are not sufficient to deploy the solution and requires more analysis. When recommending such a solution, analysts consider:
|
2.5.2 Develop Implementation Plan
An implementation plan outlines the implementation strategy and includes a road map of the changes and tasks that must be completed to ensure the successful implementation of a change. Implementation plans for an analytics initiative are no different than implementation plans for other types of initiatives.
The implementation plan includes tasks, sub-tasks, resources, and high-level estimates provided by the stakeholders responsible for completing the tasks and a sequence showing flow and task dependencies. Constraints, assumptions, risks, and dependencies are also identified and discussed.
When developing an implementation plan, analysts break down the work to implement the proposed changes. Functional decomposition is a technique that is used to drill down high-level tasks into lower-level tasks and activities. This often takes the form of a work breakdown structure or story maps.
Brainstorming, and a variety of elicitation techniques, are used to identify an initial list of tasks for the plan. Skills in facilitation to lead planning discussions are helpful when developing an implementation plan.
2.5.3 Manage Change
Change originating out of an analytics initiative may be managed by a change management team, which analysts support, or analysts may hold the role of change manager. In this role they oversee the transformation of the analysis results into implemented policies and procedures within the organization. Implementing change is the end goal and it is where the organization realizes the value from its analytics efforts.
Business analysts are well suited in fulfilling the role of change manager as they are able to ensure the continuity between the analytics work and implementation. Before implementing changes, stakeholders agree on what changes to make. Similar to other types of projects, there is a level of effort required to analyze the options and understand the constraints, risks, assumptions, costs, and value proposition for each option before a decision can be made on the type of change to be implemented. Analysts play an important role in facilitating discussions, explaining options, and driving the decision-making process.
When managing change, analysts use various types of models to communicate existing processes and workflows. The same models can be used to show proposed changes. Organization models, process models, and sequence diagrams are some of these models. Systems thinking skills are helpful in understanding the people, processes, and technologies. Analysts also provide information on how best to make changes that are based on analytics results. Analysts leverage teaching skills effectively to communicate proposed procedural changes. Decision-making skills aid in facilitating agreements on the types of changes to be made.
2.5.4 Select Techniques for Use Results to Influence Business Decision-Making
The following is a selection of some commonly used analysis and analytics techniques applicable to the Use Results to Influence Decision-Making domain. The following list of techniques does not represent a comprehensive set of techniques used by an analyst in the Use Results to Influence Decision- Making domain but presents a small, but useful, set of techniques that can be used.
The following is a selection of some commonly used analysis and analytics techniques applicable to the Use Results to Influence Decision-Making domain. The following list of techniques does not represent a comprehensive set of techniques used by an analyst in the Use Results to Influence Decision- Making domain but presents a small, but useful, set of techniques that can be used.
| Techniques | Usage Context for Business Data Analytics | BABOK® Guide v3.0 Reference |
| Acceptance and Evaluation Criteria | Used for evaluating recommendations from analytics against agreed-upon acceptance criteria and the alignment with the business need. | Chapter 10.1 |
| Balanced Scorecard | Used for assessing organizational impact by implementing recommended actions or any alternate solution. | Chapter 10.3 |
| Benchmarking and Market Analysis | Used to evaluate competitor and market reactions if certain recommendations from the analytics initiative are implemented. | Chapter 10.4 |
| Decision Analysis | Used to understand and assess the recommendations and alignment of recommendation to business problems.. Multiple tools such as decision trees, multi-factor analysis, and sensitivity analysis can be performed to evaluate the recommendations. | Chapter 10.16 |
| Financial Analysis | Used to evaluate financial performance when recommended actions or alternate solutions are implemented. | Chapter 10.20 |
| Lessons Learned | Used to compile the learnings from the analytics initiative with respect to improvements that can be made to the analytics approach, data resources, analytics capabilities, and organizational capabilities that can be leveraged for future initiatives. | Chapter 10.27 |
| Organizational Modelling | Used to assist change management where the organizational model is being impacted. | Chapter 10.32 |
| Prioritization | Used to prioritize recommendations or solution options arising out of analytics initiative. | Chapter 10.33 |
| Process Analysis | Used to understand the impact of recommendations on the future state of business processes. | Chapter 10.34 |
| Risk Analysis and Management | Used to assess associated risks, constraints, and dependencies by implementing a solution approach or initiating any change. | Chapter 10.38 |
2.5.5 A Case Study for Use Results to Influence Business Decision-Making
The UK giftware and online gifting industry has gone through unprecedented changes in recent years. Retailers in this industry are experiencing cost pressures and need to increase effective marketing practices in the crowded and historically seasonal marketplace. To differentiate in this highly competitive environment, several top retailers are investing in more customized gift offerings that are personalized for newer target market segments.
.1 The Challenge
The giftware industry regularly transitions through seasonal high-demand and low-demand cycles throughout the calendar year, attributed to various influencing factors. Special occasions such as birthdays, family events (such as engagements, graduations, or weddings), and corporate events are a continuous source of revenue for the giftware industry. However, the major revenue has always been from holiday seasons like Christmas.
GiftRonline is a UK-based and registered non-store online retail company. The company mainly sells unique all-occasion gifts. Considering these aspects, GiftRonline has determined that new market segments are needed for accurate targeting than the traditional demographic segments that they have used in the past. GiftRonline has provided transactional sales data for a year to their data science team to evaluate the possibility of new segments. The data consisted of invoice details such as stock code, product description, customer identifier, unit price, ordered quantity, and delivery country of each invoice or online purchase for a year.
The data science team debated the best analytics approach to use based on the large data set they received. They considered several approaches for segmentation, including value-based segmentation, recency-frequency- monetary analysis (RFM), and psychographic segmentation. After considerable time and effort and with the help of David Brown, a business analysis professional on their team, they settled on the approach to use.
.2 Analytics Approach
The team decided to:
GiftsRonline executives were satisfied with the collaboration and communication between the business and the analytics team but were confused about how best to proceed. In particular, they were unsure about how to leverage this data to meet their original objectives. They had the following key questions:
Additional analysis was completed as David determined how best to communicate this data, and the analytics team was asked to create some key visualizations.
.5 Key Takeaways
The UK giftware and online gifting industry has gone through unprecedented changes in recent years. Retailers in this industry are experiencing cost pressures and need to increase effective marketing practices in the crowded and historically seasonal marketplace. To differentiate in this highly competitive environment, several top retailers are investing in more customized gift offerings that are personalized for newer target market segments.
.1 The Challenge
The giftware industry regularly transitions through seasonal high-demand and low-demand cycles throughout the calendar year, attributed to various influencing factors. Special occasions such as birthdays, family events (such as engagements, graduations, or weddings), and corporate events are a continuous source of revenue for the giftware industry. However, the major revenue has always been from holiday seasons like Christmas.
GiftRonline is a UK-based and registered non-store online retail company. The company mainly sells unique all-occasion gifts. Considering these aspects, GiftRonline has determined that new market segments are needed for accurate targeting than the traditional demographic segments that they have used in the past. GiftRonline has provided transactional sales data for a year to their data science team to evaluate the possibility of new segments. The data consisted of invoice details such as stock code, product description, customer identifier, unit price, ordered quantity, and delivery country of each invoice or online purchase for a year.
The data science team debated the best analytics approach to use based on the large data set they received. They considered several approaches for segmentation, including value-based segmentation, recency-frequency- monetary analysis (RFM), and psychographic segmentation. After considerable time and effort and with the help of David Brown, a business analysis professional on their team, they settled on the approach to use.
.2 Analytics Approach
The team decided to:
- review product descriptions and group them into specific product baskets,
- resolve overlapping products into single product baskets, and
- cluster customers based on their propensity to buy specific product groups or basket value’
- Five product groupings or categories were identified, and customers were segregated into eleven clusters based on these product categories.
- New customers could be classified into the right cluster with almost (75%) accuracy using an optimized clustering model.
GiftsRonline executives were satisfied with the collaboration and communication between the business and the analytics team but were confused about how best to proceed. In particular, they were unsure about how to leverage this data to meet their original objectives. They had the following key questions:
- What are the product and customer segments and how best to describe their characteristics? Future marketing strategies will revolve around deeper understanding of these segments. The current groupings simply label the segments as cluster no.0, cluster no.1, and so forth.
- How do we operationalize results into the current business? For example, based on these categories are there any recommendations that stand out?
Additional analysis was completed as David determined how best to communicate this data, and the analytics team was asked to create some key visualizations.
- The team produced a word cloud to demonstrate new product category identifiers.
Keywords were extracted from product descriptions within a category: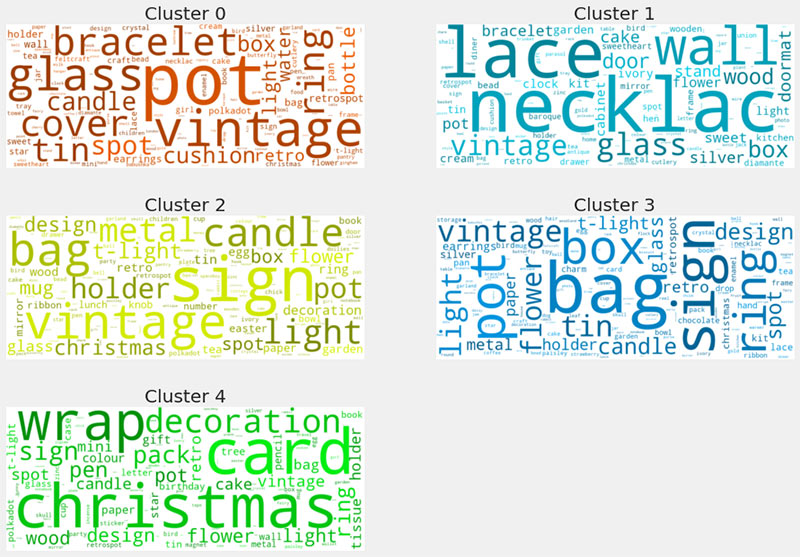
David used the word cloud to highlight and recommend easily understandable cluster names to best describe the product categories. For example, cluster no.2 contains products associated with “Holiday crafts” and cluster no.4 was renamed “Jewelry & Luxury”.
The team then cross-referenced product categories with item values and delivery information for a more refined description of each product category. These were used to help key stakeholders understand product and customer segments. - The team produced spider chart visualizations to clearly differentiate segments.
This chart described each customer segment with individual axes as categories and included attributes such as count (number of purchase visits), mean (average price paid per order), and sum (average spend per customer):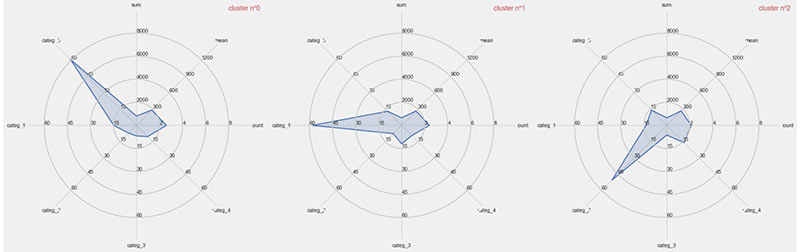
Note: for simplicity, this diagram only depicts the first three categories out of 11.
From the visual, it could be clearly deduced that each customer segment has a distinct propensity towards a product group, which validated the findings and the analytical approach. - To operationalize these findings, David conducted a feasibility study to integrate the analytics finding with the GiftRonline CRM application and provided recommendation aligned to the new marketing segments.
.5 Key Takeaways
- Data insights can influence business decisions, but those insights need to be effectively communicated. The starting point is to develop a shared understanding of analytics results and insights from those results. By leveraging business analysis techniques, the analytics team was able to:
- Effectively communicate the outcomes of the analytics work.
- Develop a shared understanding of what the data was demonstrating.
- Use their insights to influence decision-making.