
2. Business Data Analytics Domains and Tasks
2.3 Analyze Data
Guide to Business Data Analytics
- preparing the data for analysis,
- performing the data analysis,
- determining whether the analytical solution/results are helping to answer the business question, and
- making adjustments to the approach when they do not.
Tasks in the Analyze Data domain include:
- Develop Data Analysis Plan,
- Prepare Data,
- Explore Data,
- Perform Data Analysis, and
- Assess the Analytics and System Approach Taken.
2.3.1 Develop Data Analysis Plan
The data analysis plan may be formal or informal. The objective is to ensure sufficient time to plan the data analysis activities required for the initiative.
When developing the data analysis plan, the analyst determines:
If the data analysis plan is formally documented, analysts use templates to ensure consistency and guide planning decisions. Analysts use metrics and key performance indicators to assist the data scientist in determining if the outcomes from data analysis are producing the results required to address the business need. Organizational knowledge helps business analysis professionals provide the context for the data scientist's work.
The data analysis plan may be formal or informal. The objective is to ensure sufficient time to plan the data analysis activities required for the initiative.
When developing the data analysis plan, the analyst determines:
- which mathematical or statistical techniques the data scientist plans to use,
- which statistical and algorithmic models are expected for use (such as regression, logistics regression, decision trees/random forest, support vector machines, and neural nets),
- which data sources will be used and how data will be linked or joined, and
- how data will be preprocessed and cleaned.
If the data analysis plan is formally documented, analysts use templates to ensure consistency and guide planning decisions. Analysts use metrics and key performance indicators to assist the data scientist in determining if the outcomes from data analysis are producing the results required to address the business need. Organizational knowledge helps business analysis professionals provide the context for the data scientist's work.
| Planning Business Data Analytics Approach at Various Stages Analysts may not require a rigorous understanding of the various algorithmic models used in predictive analytics exercises, but it is helpful to understand these at a high-level. A foundational understanding of these models help analysts describe what models are being considered, and why, to stakeholders. A limited sample of different models is presented below with some of their advantages and disadvantages.
|
2.3.2 Prepare Data
Preparing data involves obtaining access to the planned data sources and establishing the relationships and linkages between sources in order to create a coherent dataset. Data scientists identify how different datasets are related, consider whether the data can be linked in theory, and decide whether it can happen in practice.
Preparing data includes understanding the relationships that exist between data. For example, do two tables have a 0 to 1, 1 to 1, or 1 to many relationships? Preparing data also involves establishing the joins or linkages between sources, normalizing data to reduce data redundancy, standardization, scaling, and converting data. Sometimes the data collected is uninterpretable and must be transformed to lend value to the analytics effort. Data cleansing is a process by which data is transformed to correct or remove bad data.
Data preprocessing, scaling, normalization, imputation, and cleansing are some of the common terminologies used in analytics.
Data scientists identify the rules for consolidating data, perform the consolidation, and then validate the results to see if the business rules are being adhered to. Any mechanisms data scientists build to automate the data acquisition or preparation processes can be repurposed for use by other analytics teams.
Data scientists leverage a host of techniques when preparing data. Weighting is one technique applied to data to correct bias. Sample weights can be applied to address the probability of unequal samples and survey weights applied to address bias in surveys. Data scientists use strong technical skills and knowledge of statistics when preparing data for use in an analytics initiative.
When preparing data, analysts provide the business context for data that may or may not differ from the statistical interpretation. For example, if there are missing data elements, a data scientist may choose to attribute those elements with mean or median value to retain the distribution of a variable intact. While this may be a sound approach from a statistical point of view, it may conflict with some business rules which the analyst may be able to highlight.
Similarly, if there is a portion of the data with missing information, a data scientist may choose to ignore the observations and continue the analysis because it may be statistically insignificant. But from a business standpoint further investigation may be required to determine the course of analysis. These scenarios are best handled by analysts with facilitation, collaboration, and elicitation skills who can supplement the information by stakeholder collaboration and investigation of the recording process.
2.3.3 Explore Data
Exploring data involves performing an initial exploratory analysis to ensure the data being collected is what was expected from the data sources. It provides a form of quality check to ensure the right type and quality of data is being obtained prior to executing more detailed data analysis work.
Data exploration is primarily the responsibility of the data scientist, but the work is most effectively performed when paired with an understanding of the business domain, an area where a business analysis professional can lend much assistance.
Exploratory analysis involves obtaining a subset of data and identifying initial trends and relationships to develop a fair understanding of the value the data is providing. The data scientist looks for data gaps or data redundancy that signal the data may need to be cleansed, or data outliers (noise) that signal data may need to be excluded. Missing data from a survey could mean a person is missing from the dataset or that a person might have only answered certain questions on a survey. The data scientist assesses the data quality to determine the course of action using the following checkpoints:
Where possible, and when required, data scientists transform data, removing unrecognized data elements or converting data to a consistent data format when disparate data formats exist. If the data collection processes are not providing a sufficient amount of good data, the data scientist determines a new approach to sourcing the data. This may involve establishing new joins or relationships between data or identifying completely new data sources. It might be necessary to go back and consider whether there are other datasets that could be collected if the first dataset is not usable.
Exploratory data analysis activities are more involved than data preparation activities. They provide opportunities for analysts and data scientists to discover latent data gaps, interrelationships between variables, and allow multiple statistical tests to determine whether data is equitable for the research problem. Once there is an assurance that the data sources are providing the right data, what is learned from the exploratory analysis can be used to guide the approach taken to perform the detailed data analysis.
When exploring data, analysts use data mining to identify information or patterns that require further investigation. Data scientists use a host of data discovery and profiling tools to mine data. They use statistical parameters and visualizations to determine data quality. For example, histograms can be used to understand the distribution of values across variables. Feedback loops are used to allow for adjustments to be made about what techniques and models best fit the data. Ongoing collaboration between the data scientist and the business analysis practitioner pairs the industry and business domain knowledge possessed by the business analyst practitioner with the analysis results produced by the data scientist to determine whether the results are helping to answer the business question.
Exploring data involves performing an initial exploratory analysis to ensure the data being collected is what was expected from the data sources. It provides a form of quality check to ensure the right type and quality of data is being obtained prior to executing more detailed data analysis work.
Data exploration is primarily the responsibility of the data scientist, but the work is most effectively performed when paired with an understanding of the business domain, an area where a business analysis professional can lend much assistance.
Exploratory analysis involves obtaining a subset of data and identifying initial trends and relationships to develop a fair understanding of the value the data is providing. The data scientist looks for data gaps or data redundancy that signal the data may need to be cleansed, or data outliers (noise) that signal data may need to be excluded. Missing data from a survey could mean a person is missing from the dataset or that a person might have only answered certain questions on a survey. The data scientist assesses the data quality to determine the course of action using the following checkpoints:
- Data integrity: Can the data be trusted? For example, is the data structurally correct?
- Data validity: Is the data truly representative of an underlying construct? For example, is Win ratio a good measure of monthly sales performance?
- Data reliability: If data is collected more than once, will the same results be obtained? For example, will a survey respondent answer a question differently on different days of the week?
- Data bias: Does the data portray an accurate picture of a given situation? It indicates underlying quality issues which may involve issues with integrity, validity, or reliability. For example, are employees over- estimating the quality of their work or do we have a situation where the survey participants are not a representative sample of the population?
Where possible, and when required, data scientists transform data, removing unrecognized data elements or converting data to a consistent data format when disparate data formats exist. If the data collection processes are not providing a sufficient amount of good data, the data scientist determines a new approach to sourcing the data. This may involve establishing new joins or relationships between data or identifying completely new data sources. It might be necessary to go back and consider whether there are other datasets that could be collected if the first dataset is not usable.
Exploratory data analysis activities are more involved than data preparation activities. They provide opportunities for analysts and data scientists to discover latent data gaps, interrelationships between variables, and allow multiple statistical tests to determine whether data is equitable for the research problem. Once there is an assurance that the data sources are providing the right data, what is learned from the exploratory analysis can be used to guide the approach taken to perform the detailed data analysis.
When exploring data, analysts use data mining to identify information or patterns that require further investigation. Data scientists use a host of data discovery and profiling tools to mine data. They use statistical parameters and visualizations to determine data quality. For example, histograms can be used to understand the distribution of values across variables. Feedback loops are used to allow for adjustments to be made about what techniques and models best fit the data. Ongoing collaboration between the data scientist and the business analysis practitioner pairs the industry and business domain knowledge possessed by the business analyst practitioner with the analysis results produced by the data scientist to determine whether the results are helping to answer the business question.
| An Example of Exploratory Data Analysis and its Benefits Exploratory data analysis is a systematic and iterative approach used for:
When the data was explored, some of the observations for house prices were found to be outliers when compared to most house prices. Although the data exists, it may influence the final predictions hence the data scientist would have to determine whether to exclude the data or not. An analyst can help in this situation by assessing the data collection method to identify if there are any missed business rules. It was found these observations are artificially set to a high value of $50,000 to signify observations where the prices cannot be disclosed. This analysis supports the data scientists remark that some values are outliers and should be excluded from future analysis. The outliers can be graphically seen below around the $50,000 mark. 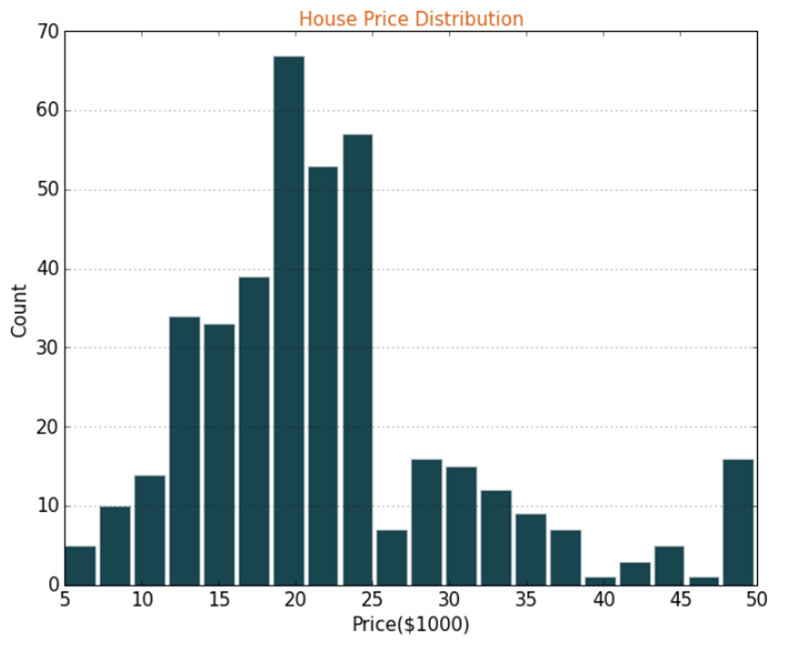 Likewise, when some of the variables are compared against the prices, it was observed that most predictors have a linear relationship with price. For example, some change in the predictor variable changes the price by a proportional amount and has a straight-line relationship, as illustrated below. 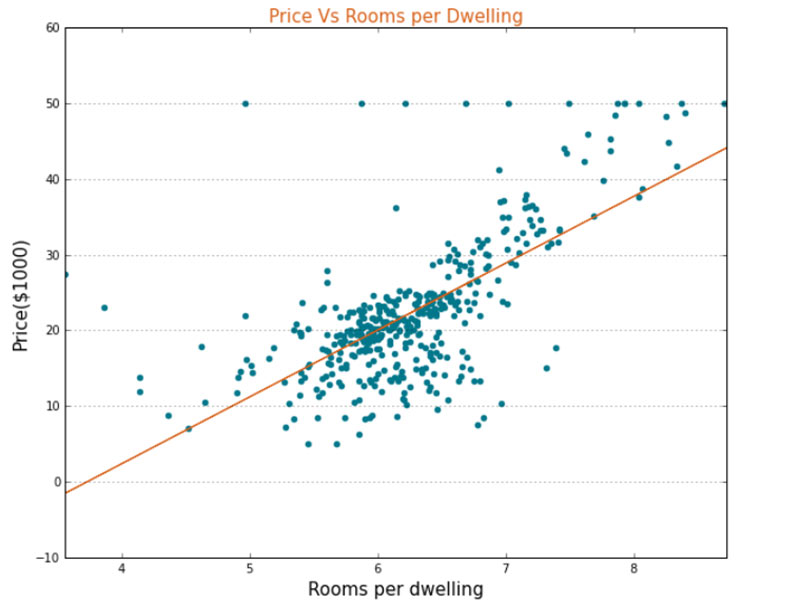 This indicates that a linear model such as Ordinary least squares regression can be used for predicting house prices as a candidate prediction model. In summary, analyst and data scientists can use the outcome of exploratory data analysis to make critical decisions with respect to data quality and modelling approach. The analysts can also use the visuals from the data exploration phase to explain and justify a course of action taken in an analytics exercise. |
2.3.4 Perform Data Analysis
Data analysis involves the extensive deep analysis performed once the data quality issues are resolved through exploratory analysis. Performing data analysis involves the application of mathematics, statistics, and the completion of extensive mathematical analyses related to answering the research questions for different stakeholders.
Where exploratory analysis tested the dataset, performing data analysis involves using the results of an exploratory analysis to determine the best mathematical methods and approaches to use and then conducting the in- depth data analysis required to answer the analytics problem. The original research question in the business language is transformed into a mathematical question, which is translated into a model to perform a deeper analysis.
When performing data analysis, data scientists use technical techniques requiring extensive mathematical skills. Some techniques are leveraged to find associations or to cluster data, which is helpful when identifying patterns (for example, association rule learning, decision tree analysis, and K-means clustering.) Many techniques, such as the use of machine learning and artificial intelligence, advance the data scientist's analysis capabilities. Data scientists may use regression analysis to predict and forecast. Simulation can be used to play out a series of actions or behaviours.
Many of the algorithmic models are automated through available machine learning packages, but the parameters and measures of success require significant business domain knowledge to be aligned to the research questions. For example, an organization seeking to discover market segments based on the order history and customer profile data may require some marketing guidance on how the segments should be discovered. It may depend on demography, monetary value, type of products the customers purchase, customer lifetime value, and other factors. The choice of the clustering model may be influenced based on the business direction. Similarly, most of the success criteria for models are also influenced by business decisions that need to be translated into mathematical parameters where analysts may contribute significantly by describing the success criteria to the data scientists.
Data scientists use creative thinking skills to determine different approaches for answering the research question, especially when the data results are not helping to achieve the stated objectives. As with exploratory analysis, the data scientist uses industry and business domain knowledge, and when not present, these skills can be augmented by leveraging the skills of the business analysis professional.
2.3.5 Assess the Analytics and System Approach Taken
Assessing the analytics and system approach taken involves collaborating as an analytics team to determine whether the results from data exploration or data analysis are helping to answer the business question. Assessing the analytics approach is performed iteratively with Explore Data and Analyze Data.
When issues arise with data sourcing or with the results of data analysis, the approach to analytics adapts. For example, when data exploration uncovers issues with data quality or determines the wrong data is being collected, or data gaps are an issue, there may be a need for adjustments to be made to how and where the data is being collected. If the results of data exploration are acceptable, it is still possible the results from data analysis will fail to answer the questions being asked. The results from data analysis may not produce results that help meet the objectives of the initiative.
In these scenarios, data exploration and data analysis tasks are repeated. Iteration occurs between the data exploration and data analysis tasks until the data scientist is comfortable with the data sources being used. Their assessment is based on the quality of data being obtained and its value toward answering the research questions.
When assessing the analytics and system approach taken, business analysis professionals require basic skills in statistics and a basic understanding of data science tools and technologies. They should possess sufficient business acumen to provide context to the data analysis. Business analysis professionals answer questions the data scientist may pose related to the business. Adaptability is necessary to adjust the analysis approach as more data is uncovered, new insights learned, or different levels of stakeholders are involved. Trustworthiness is important as in some industries, having access to certain types of data comes with a great deal of responsibility, often with legal implications. It is important to know what acceptable data use is and what it is not, and what can be accessed or viewed and what cannot.
| Real-World Example of Analytics Challenges and Course Correction In highly competitive markets, organizations struggle to get the right message to the customers, at the right time. To achieve this, marketing teams use “hyper- personalization” to target their messaging to their customers. Whether a particular campaign will have a significant impact on sales is a question of concern for most marketing teams. This is a research problem. For example, what is the likely outcome if a campaign is launched and which potential customers are likely to purchase. This is an example of a question suited for prescriptive analytics. Consider an organization launching a campaign to offer a 10% discount on a digital product. The organization also wants to reduce the cost of campaigning by limiting the number of customers they want to target. The organization collected data on 50,000 customers and leads from their CRM system (often referred to as population or population set), and were trying to decide what the campaign will be, in terms of potential customers who will buy the product. The data included variables such as age, geography, gender, different product features, existing customer or not, and has the customer purchased the product in the past or not. The analytical approach, broadly, was as follows:
An algorithmic model (for example, logistic regression) was considered and although the training performance was considerably high, the testing performance was found to be low. The data scientist suggested there is a possibility the variable considered may not be a true predictor for the given problem. For example, there are two groups, existing customers and leads, who will have different purchasing behaviours even though the values of the other variables are similar. Additionally, there may be other variables missing from analysis such as income or level of education, which are influencing one or more variables that are part of the analysis and the missing variables may be the true predictors. In statistical terms, these are called confounding variables. The analytics initiative now has a choice:
|
2.3.6 Select Techniques for Analyze Data
The following is a selection of some commonly used analysis and analytics techniques applicable to the Analyze Data domain. The following list of techniques does not represent a comprehensive set of techniques used by an analyst in the Analyze Data domain but presents a small, but useful, set of techniques that can be used.
The following is a selection of some commonly used analysis and analytics techniques applicable to the Analyze Data domain. The following list of techniques does not represent a comprehensive set of techniques used by an analyst in the Analyze Data domain but presents a small, but useful, set of techniques that can be used.
| Techniques | Usage Context for Business Data Analytics | BABOK® Guide v 3.0 Reference |
| Business Case | Used to understand the high-level needs of the business and align the analytics effort to qualify the desired outcome. | Chapter 10.7 |
| Decision Analysis | Used to understand the multiple decision threads and the rationale behind following a particular course of action. For example, the decisions taken by data scientists for data sampling, data transformation, choice of model, and evaluation criteria are validated against the business and statistical parameters. | Chapter 10.16 |
| Financial Analysis | Used to support the decision process by understanding the costs, benefits, financial impact, and business value. | Chapter 10.20 |
| Key Performance Indicators (KPIs) | Used to evaluate the relevant metrics, KPIs, and model criteria to establish the most accurate representation of evaluation parameters for the analytics model. For example, while determining the objective/cost function of a predictive analytics model, KPIs and metrics need to be translated to the mathematical model correctly. | Chapter 10.28 |
| Observation | Used to understand and analyze the data activities and processes to uncover any information that may impact the success of the analytics initiative. | Chapter 10.31 |
| Reviews | Used to understand the whole process of data analytics versus simply evaluating the outcome of the analytics initiative. | Chapter 10.37 |
| Risk Analysis and Management | Used to record and control the inherent risks and assumptions originating due to a certain approach taken for the analytics initiative. | Chapter 10.38 |
| Scope Modelling | Used when re-scoping is needed during the initiative when the analytics objectives, the data, choice of models, or evaluation criteria change. | Chapter 10.41 |
| Data Journalism and Storytelling | Used to communicate the actions and the results of the data analytics initiative to stakeholders in the Analyze Data domain. | N/A |
| Descriptive and Inferential Statistics | Used to understand the underlying data patterns and signals during exploratory data analysis and modelling. Descriptive statistics is primarily used to describe the data in a more cohesive manner. Inferential statistics is used for predictive and prescriptive modelling (for example, a bayesian inference model). | N/A |
| Technical Visualizations | Used to understand the underlying patterns and signals from data in a visual format during exploratory data analysis and data modelling. Technical visualizations are used to analyze the data, while business visualizations are used to interpret and report results. |
N/A |
| Machine Learning (ML)/ Deep Learning (DL) | Used to predict or prescribe outcomes. Data scientists understand the mathematical constructs used in ML and DL to achieve a better model performance. Analysts understand and communicate the characteristics of different models. For example, a Naïve Bayes model can be used effectively as spam detection with a cheaper cost of implementation and less data volume. | N/A |
| Optimization | Used to derive the best possible business outcome where a number of constraints exist. Analysts identify constraints and assess whether it is considered during data analysis and modelling, For example, linear programming in a simple production decision to complex gradient methods for weight optimization in deep learning problems. | N/A |
| Simulation | Used to derive and demonstrate possible business outcomes when there is a lack of observed data, a high degree of uncertainty, or an extremely high number of modelling parameters are present. Simulation can be effective where the problems may not be solved adequately given the time, schedule, cost, or computing constraints. Even with deep learning and big data technologies, it is sometimes difficult to accurately determine solutions analytically. In such cases simulation is used to solve a problem heuristically. Prescriptive analytics and specifically reinforcement learning problems heavily utilize simulations, for example, monte carlo simulations can be used to generate “good enough” models for estimating a portfolio risk in investment banking and risk management. |
N/A |
2.3.7 A Case Study for Analyze Data
ABC insurance Co., one of the largest issuers of life insurance in Japan, formed a new data science team comprised of data scientists, actuaries, insurance underwriters, and business data analytics professionals. Their mandate is to challenge the status quo and address existing customer experience challenges. This team promotes new ways of working, including evidence-based decision-making, in the hopes of helping ABC become more responsive to market demands and organizational priorities. In many ways, the goal is to introduce a "start-up culture" into a one-hundred years-old traditionally structured insurance company.
.1 The Challenge
The team conducted a thorough current state analysis of the existing processes that shape customer experience and how ABC uses technology to support its underwriting, quoting, and policy issuing functions. The team identified a number of challenges:
the application process is cumbersome, taking approximately a month to approve.
applicants are asked to provide extensive information including demographic information, medical history, and employment information taking 90 minutes to enter.
they are asked to select among several insurance products or combinations of products
The result? Customers are disengaging, as demonstrated by ABC Insurance's web analytics, which indicate 35% of individuals end their transaction prematurely during the application process.
The team's senior business data analytics expert, Haru Kobayashi, was asked to analyze the data and recommend actions. In addition to reviewing the data collected through the current state analysis, he also analyzed the results of interviews conducted by the team. They interviewed both customers and individuals that abandoned their online applications. Haru analyzed all this data and concluded that consumers are accustomed to seamless online transactions. Respondents acknowledged the need for providing a large amount of information, but they expect the organizations they interact with to provide seamless transactions or risk losing them as a customer.
.2 The Way Forward
The team concluded that ABC's processes are antiquated and inefficient. They believed it was important to make it easier for applicants to submit their information and reduce the time it takes to issue a quote. They also identified the disconnect between an applicant entering information online and the manual processing that takes place to verify information, assess the risk, generate a quote, and respond to the applicant.
The team recommended ABC utilize a technology-based solution, one that delivers a predictive data analytics model and can be customized to accurately classify risk using ABC's standard approach. Using this type of technology can significantly reduce the time taken for approval. The team's immediate goal was to better understand the predictive power of the data from existing underwriting assessments and to enable ABC to use that information to improve the overall process.
.3 Working with Available Data
The team worked with approximately 80,000 customer applications and almost 130 predictor variables. Haru parsed through the data to understand what could be useful and how the data could be used. His initial analysis allowed the team to rationalize data items, understand reasons for missing data, determine what data needs to be input, develop rationale to be followed, and develop a more robust data set.
After transforming the available data, it was categorized into different business relevant data elements such as product information, age, height, weight, employment information, insured information, insurance history, family history, and medical history.
.4 Identifying Key Questions
Initial analysis of the business context suggested that most of the time was spent in risk classification. The team agreed that the biggest reduction in processing time would result from automatically and accurately classifying customer applications to appropriate risk classes. By doing so, the application processing time could be dramatically reduced. Data scientists on the team considered multiple algorithms to produce the desired results. They had some fundamental questions to better understand the data required by underwriters, including:
.5 Business Data Analytics Approach
Often, the underlying concepts and mathematical background required to understand data-related challenges turn out to be quite complex. The heavy use of data science terminology by data scientists was not understood by business stakeholders, in this case the underwriters on the team. Likewise, the data scientists were struggling to understand business needs. Haru developed the following approach:
Haru worked hard to socialize understanding of several key terms and business rules and helped others understand the impact of their decisions, including:
Haru's data analysis experience and his ability to bridge the two worlds of data science and business ensured the team achieved its desired outcome.
.7 Key Takeaways
ABC insurance Co., one of the largest issuers of life insurance in Japan, formed a new data science team comprised of data scientists, actuaries, insurance underwriters, and business data analytics professionals. Their mandate is to challenge the status quo and address existing customer experience challenges. This team promotes new ways of working, including evidence-based decision-making, in the hopes of helping ABC become more responsive to market demands and organizational priorities. In many ways, the goal is to introduce a "start-up culture" into a one-hundred years-old traditionally structured insurance company.
.1 The Challenge
The team conducted a thorough current state analysis of the existing processes that shape customer experience and how ABC uses technology to support its underwriting, quoting, and policy issuing functions. The team identified a number of challenges:
the application process is cumbersome, taking approximately a month to approve.
applicants are asked to provide extensive information including demographic information, medical history, and employment information taking 90 minutes to enter.
they are asked to select among several insurance products or combinations of products
The result? Customers are disengaging, as demonstrated by ABC Insurance's web analytics, which indicate 35% of individuals end their transaction prematurely during the application process.
The team's senior business data analytics expert, Haru Kobayashi, was asked to analyze the data and recommend actions. In addition to reviewing the data collected through the current state analysis, he also analyzed the results of interviews conducted by the team. They interviewed both customers and individuals that abandoned their online applications. Haru analyzed all this data and concluded that consumers are accustomed to seamless online transactions. Respondents acknowledged the need for providing a large amount of information, but they expect the organizations they interact with to provide seamless transactions or risk losing them as a customer.
.2 The Way Forward
The team concluded that ABC's processes are antiquated and inefficient. They believed it was important to make it easier for applicants to submit their information and reduce the time it takes to issue a quote. They also identified the disconnect between an applicant entering information online and the manual processing that takes place to verify information, assess the risk, generate a quote, and respond to the applicant.
The team recommended ABC utilize a technology-based solution, one that delivers a predictive data analytics model and can be customized to accurately classify risk using ABC's standard approach. Using this type of technology can significantly reduce the time taken for approval. The team's immediate goal was to better understand the predictive power of the data from existing underwriting assessments and to enable ABC to use that information to improve the overall process.
.3 Working with Available Data
The team worked with approximately 80,000 customer applications and almost 130 predictor variables. Haru parsed through the data to understand what could be useful and how the data could be used. His initial analysis allowed the team to rationalize data items, understand reasons for missing data, determine what data needs to be input, develop rationale to be followed, and develop a more robust data set.
After transforming the available data, it was categorized into different business relevant data elements such as product information, age, height, weight, employment information, insured information, insurance history, family history, and medical history.
.4 Identifying Key Questions
Initial analysis of the business context suggested that most of the time was spent in risk classification. The team agreed that the biggest reduction in processing time would result from automatically and accurately classifying customer applications to appropriate risk classes. By doing so, the application processing time could be dramatically reduced. Data scientists on the team considered multiple algorithms to produce the desired results. They had some fundamental questions to better understand the data required by underwriters, including:
- How are risk classes related? Do risk classes depend on each other? Are they categorical in nature?
- Is the risk function monotonic?
- Is this a multinomial classification problem?
- What is the best metric to evaluate performance of the predictive model - Accuracy, MCC, or Cohen Kappa?
.5 Business Data Analytics Approach
Often, the underlying concepts and mathematical background required to understand data-related challenges turn out to be quite complex. The heavy use of data science terminology by data scientists was not understood by business stakeholders, in this case the underwriters on the team. Likewise, the data scientists were struggling to understand business needs. Haru developed the following approach:
- Collaborate closely with data scientists to learn terminology.
- Understand the relevance of the questions asked by the data scientists.
- Translate this learning to business terms that would be meaningful to underwriters.
- Communicate the correct business implications so the team could develop a shared understanding of the proposed model.
Haru worked hard to socialize understanding of several key terms and business rules and helped others understand the impact of their decisions, including:
| Key Terms | Application to Predictive Models/Algorithms |
| Categorical Risk Classes Insurance risk classes describe groups of individuals with similar risk characteristics. For example, 20-40 years of age, new driver, or smoker may be grouped and classified into a higher risk class and therefore a higher cost to insure. |
With this understanding, the team identified categories and determined an effective algorithm to use in the predictive model with output aligned to a single specific risk class (for example, 1 to 8). |
| Monotonic Risk Function The risk classes are ordinal if the outcome (risk class) follows a specific order. In other words, does risk class 3 have a higher risk profile than risk classes 2 and 1? Similarly, does the risk increase or decrease based on an increasing or decreasing input? For example, the output (likelihood of death) may be monotonic if the input is age. |
The behaviour of expected output determines the modelling process. In this case, if an algorithm outputs the probability of the event, then the business stakeholders may have to qualify what the risk classes mean. For example, probability of death of 1-50% may correspond to risk class 1, 50-60% may correspond to risk class 2 and so forth. The modelling must take these aspects into account, and that requires a shared understanding between business stakeholders and the team. |
| Multinomial Classification Simply stated, it means that the output of the predictive model is one of the eight risk classes. |
Like other classification problems, different parameters such as accuracy, precision, and others can be used, but these parameters may not be robust in evaluating the performance of the predictive model. |
| Accuracy, Matthews Correlation Coefficient (MCC), or Cohen's Kappa Coefficient These measure algorithm performance. The mathematical background for these metrics needs to be applied for the business context. For example, Cohen's Kappa may be explained in simple terms to the business stakeholder as two underwriters (A and B) are trying to classify the same set of applications independently into two risk classes (for example, 1, 2). Accuracy is the metric that describes the probability or percentage of times both underwriters agree on the risk class for an application. However, underwriters may agree on the risk class by pure chance, say due to lack of information or uncertainty. The Kappa corrects this issue. |
The entire focus of modelling and optimization of an algorithm depends upon the definition of success for the algorithm, so it is important to accurately communicate modelling assumptions. The evaluation criteria adopted by the team needs to be communicated to the business stakeholders or there may be other criteria that business stakeholders may think are more relevant (for example, the actuaries may suggest a different one). The success of the entire initiative depends upon what is chosen as the evaluation parameter. Any measure of success must be consistent with the business problem and help create a shared understanding of their use. |
Haru's data analysis experience and his ability to bridge the two worlds of data science and business ensured the team achieved its desired outcome.
.7 Key Takeaways
- When data is analyzed from an algorithmic or modelling perspective, the challenge is to translate many of the technically challenging questions to more accessible format for business stakeholders.
- Business data analytics experts combine their business analysis skills with their data analytics skills and leverage underlying competencies such as learning, systems thinking, business acumen, and teaching throughout their work.
- Business data analytics experts play a key role in helping develop shared understanding, including the ability to translate complex data analytics concepts and describe their potential impact on business results. A shared understanding between different teams often forms the first step towards managing the change implications from an analytics initiative.