
3. Techniques
3.12 Hypothesis Formulation and Testing
Guide to Business Data Analytics
3.12.1 Purpose
Hypothesis formulation and testing is used in business decision-making where business hypotheses are formulated in a rigorous manner to avoid purely empirical decisions. It is primarily used in problem analysis to transform intuitive assessments to a verifiable and measurable assessment or a research problem.
Hypothesis formulation and testing is used in business decision-making where business hypotheses are formulated in a rigorous manner to avoid purely empirical decisions. It is primarily used in problem analysis to transform intuitive assessments to a verifiable and measurable assessment or a research problem.
3.12.2 Description
Hypothesis formulation and testing provides a scientific way to verify hunches, intuition, and experience-based decisions.
Hypothesis testing is also useful when data captured is limited to only a subset or sample of the whole population. For example, a survey may be conducted on a limited number of customers to assess the net promoter score (NPS). The NPS of this sample may not be completely accurate for the entire customer base. Hypothesis testing is used to assign a confidence interval (for example, 95% or 99%) through which a likelihood of the result being correct can be established.
Many variants of hypothesis tests exist, such as t-test, z-test, F-test, and chi square test, which are selected depending upon the circumstance. While the statistical background for each of these types can be reviewed through business statistics textbooks, the primary skill set for an analyst utilizing these techniques is in the formulation of a hypothesis based on the business context and the resulting inference the hypothesis test provides. A data team conducts these tests, and the test results are shared with stakeholders.
The following topics are useful in understanding and interpreting the results of hypothesis testing:
- Standardized population and test statistics and their distributions (for example, normal, t, chi square distributions, and the standardized probabilities).
- Central limit theorem and its application in statistics.
- One-tailed and two-tailed tests and associated type I and II errors.
| Scenario | Hypothesis Formulation | Type of Test | Analysis |
| A bank executive has gathered survey data on 100 customers and observed that average weekly visits are 4.5 per customer with a standard deviation of 2. It indicates that every customer is visiting around 4.5 times a week to the bank. However, the banker believes that the average visit is greater than 5 based on his experience and that the survey is not accurate. A separate study recommends closing 50% of teller windows if weekly average visits are less than 5 to reduce cost. |
Null Hypothesis. H0: The average weekly visit is greater than 5. (H0:μ > 5) |
Lower-tailed z test. Significance level is assumed to be at 5%, and computed sample standard deviation is 2. Standard error= 2/√100 = 0.2 Computed z statistic = 4.5-5/0.2=-2.5 At 5% significance (or 95% confidence level), the z score is -1.65, which is greater than -2.5. Hence, the null hypothesis can be rejected. |
This z-test indicates that the banker’s assumptions that there are more visits per week is statistically not sound. The recommendation of closing 50% teller window should not be considered. Analysts could utilize this z-test result to look for more information. For example, the banker may be thinking about pay days when the visits are generally higher. |
3.12.3 Elements
.1 Hypothesis Testing Process
Formal hypothesis testing is a statistical process aiding decision-making, refining the research question, and determining whether a variable is a good predictor of the result. For example, an organization might be interested in understanding the impact of Twitter impressions about a product has on the overall sales. Hypothesis testing can be effective in stating that within a certain level of confidence (95%, 97.5% or 99%) it can be statistically tested whether Twitter impressions are a good predictor of sales or not.
The process can be simplified as follows:
A simple understanding of the terms used in hypothesis testing helps business analysis professionals better collaborate with data analysts and improve the interpretation and communication of the results to the business stakeholders. Some of the common terms include:
.1 Hypothesis Testing Process
Formal hypothesis testing is a statistical process aiding decision-making, refining the research question, and determining whether a variable is a good predictor of the result. For example, an organization might be interested in understanding the impact of Twitter impressions about a product has on the overall sales. Hypothesis testing can be effective in stating that within a certain level of confidence (95%, 97.5% or 99%) it can be statistically tested whether Twitter impressions are a good predictor of sales or not.
The process can be simplified as follows:
- State the hypothesis.
- Select appropriate test statistics.
- Specify the level of significance.
- State the decision rule regarding the hypothesis.
- Collect samples and calculate the sample statistics.
- Make a decision regarding the hypothesis.
- Provide insights based on the results of the test.
A simple understanding of the terms used in hypothesis testing helps business analysis professionals better collaborate with data analysts and improve the interpretation and communication of the results to the business stakeholders. Some of the common terms include:
- (Standard) Normal distribution: The most common type of probability distribution studied. It is a representation of all possible values a variable can take along with its probabilities of occurrence. The mean of this distribution is set to zero by scaling and shifting the mean to zero for easy computation and comparison.
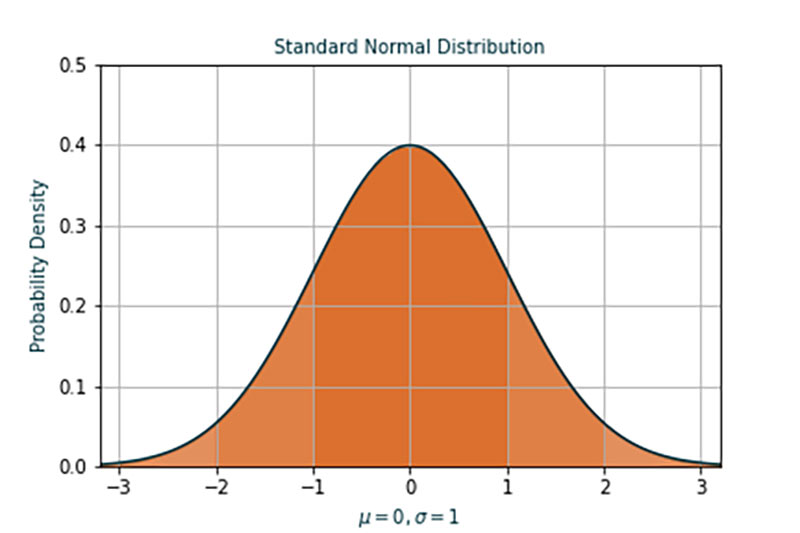
- Z score: Represents the transformed value of a variable scaled down with the standard deviation. For example, the regulation length of a baseball bat is 42 inches (for example, the true/ population mean). A randomly picked bat from a manufacturer measured to 44 inches and the manufacturer has observed a standard deviation of 5 inches. Then z score is That is, in the normal distribution graph this observation is on 0.4 to the right of the mean at 0.
- Level of Significance and Confidence Interval: It is observed that if a variable follows a normal distribution, then almost 95% of observed data (for example, values a variable can take) is between 1.96 𝜎 to -1.96 from the mean. From the baseball bat example, there is a 95% probability that any random bat chosen will have the length between (42-1.96x5, 42+1.96x5) inches. Conversely, there are 5% of significant values which are outside this range.
- Standard Error of the Mean: When a sample is taken and the standard deviation is computed, the sample standard deviation overestimates the population standard deviation. That is, the standard deviation of a sample is usually greater than the true standard deviation. Standard error approximates the true standard deviation by correcting this error by dividing the square root of the number of observations in that sample.
- Null and Alternate Hypothesis: The null hypothesis is the default position of a claim that results in no change of the current state. Null hypothesis is denoted as H0. Alternate hypothesis is the negation of the default position. In the baseball bat example, the manufacturer says the size of the baseball bats produced is on an average 42 inches. Then the statement can be expressed as H0 = 42, H1 ≠ 42. HA or H1 represent the alternate hypothesis. The null hypothesis can be rejected or not rejected using a z test.
- One-tailed test: At times, analysts are only concerned about observing something which is only one side of the normal curve. For example, an official game cannot take place if the baseball bat length is more than 42 inches. Then significant values are only to the right of the mean. That is H0≤42 and H1>42. This type of test would have a 5% significant region to the right of the mean with a 95% confidence level. This is called a one-tailed test.
3.12.4 Usage Considerations
.1 Strengths
.1 Strengths
- Hypothesis formulation focuses analysis to a specific business phenomenon or a business problem without drifting into secondary details.
- It aids data collection by limiting the amount of data truly needed to verify a claim.
- With correct formulation of the hypothesis test, variables do not need to follow the restrictions of behaving according to normal distribution. That is, even with fewer assumptions about the underlying factors, a hypothesis test can be performed to verify an outcome.
- Advanced usage such as f score, p values can indicate the factors (variables or combinations) that can together influence a business outcome. A chi square test may be used to compare variances.
- The results from hypothesis tests can be used for further elicitation that aids decision-making.
- Hypothesis tests provide the notion of whether a claim is statistically sound or not. It is not a replacement for any analysis led conclusions or decisions through other approaches.
- Using hypothesis tests to establish a claim may ignore data signals which may be uncovered by other means such as exploratory analysis.
- The process and the results may be difficult to communicate to stakeholders. It is advisable for analysts to use simple examples to communicate how hypothesis tests work to build stakeholder confidence.
- Hypothesis testing contains errors which are probabilistic in nature. That is to say that the results do not indicate certainty of outcome. Confidence intervals with appropriate significance levels (for example, threshold values) must be included while stating the outcome of a test.