
2.3 Tasks
2.3.3 Explore Data
Guide to Business Data Analytics
Exploring data involves performing an initial exploratory analysis to ensure the data being collected is what was expected from the data sources. It provides a form of quality check to ensure the right type and quality of data is being obtained prior to executing more detailed data analysis work.
Data exploration is primarily the responsibility of the data scientist, but the work is most effectively performed when paired with an understanding of the business domain, an area where a business analysis professional can lend much assistance.
Exploratory analysis involves obtaining a subset of data and identifying initial trends and relationships to develop a fair understanding of the value the data is providing. The data scientist looks for data gaps or data redundancy that signal the data may need to be cleansed, or data outliers (noise) that signal data may need to be excluded. Missing data from a survey could mean a person is missing from the dataset or that a person might have only answered certain questions on a survey. The data scientist assesses the data quality to determine the course of action using the following checkpoints:
Where possible, and when required, data scientists transform data, removing unrecognized data elements or converting data to a consistent data format when disparate data formats exist. If the data collection processes are not providing a sufficient amount of good data, the data scientist determines a new approach to sourcing the data. This may involve establishing new joins or relationships between data or identifying completely new data sources. It might be necessary to go back and consider whether there are other datasets that could be collected if the first dataset is not usable.
Exploratory data analysis activities are more involved than data preparation activities. They provide opportunities for analysts and data scientists to discover latent data gaps, interrelationships between variables, and allow multiple statistical tests to determine whether data is equitable for the research problem. Once there is an assurance that the data sources are providing the right data, what is learned from the exploratory analysis can be used to guide the approach taken to perform the detailed data analysis.
When exploring data, analysts use data mining to identify information or patterns that require further investigation. Data scientists use a host of data discovery and profiling tools to mine data. They use statistical parameters and visualizations to determine data quality. For example, histograms can be used to understand the distribution of values across variables. Feedback loops are used to allow for adjustments to be made about what techniques and models best fit the data. Ongoing collaboration between the data scientist and the business analysis practitioner pairs the industry and business domain knowledge possessed by the business analyst practitioner with the analysis results produced by the data scientist to determine whether the results are helping to answer the business question.
Data exploration is primarily the responsibility of the data scientist, but the work is most effectively performed when paired with an understanding of the business domain, an area where a business analysis professional can lend much assistance.
Exploratory analysis involves obtaining a subset of data and identifying initial trends and relationships to develop a fair understanding of the value the data is providing. The data scientist looks for data gaps or data redundancy that signal the data may need to be cleansed, or data outliers (noise) that signal data may need to be excluded. Missing data from a survey could mean a person is missing from the dataset or that a person might have only answered certain questions on a survey. The data scientist assesses the data quality to determine the course of action using the following checkpoints:
- Data integrity: Can the data be trusted? For example, is the data structurally correct?
- Data validity: Is the data truly representative of an underlying construct? For example, is Win ratio a good measure of monthly sales performance?
- Data reliability: If data is collected more than once, will the same results be obtained? For example, will a survey respondent answer a question differently on different days of the week?
- Data bias: Does the data portray an accurate picture of a given situation? It indicates underlying quality issues which may involve issues with integrity, validity, or reliability. For example, are employees over- estimating the quality of their work or do we have a situation where the survey participants are not a representative sample of the population?
Where possible, and when required, data scientists transform data, removing unrecognized data elements or converting data to a consistent data format when disparate data formats exist. If the data collection processes are not providing a sufficient amount of good data, the data scientist determines a new approach to sourcing the data. This may involve establishing new joins or relationships between data or identifying completely new data sources. It might be necessary to go back and consider whether there are other datasets that could be collected if the first dataset is not usable.
Exploratory data analysis activities are more involved than data preparation activities. They provide opportunities for analysts and data scientists to discover latent data gaps, interrelationships between variables, and allow multiple statistical tests to determine whether data is equitable for the research problem. Once there is an assurance that the data sources are providing the right data, what is learned from the exploratory analysis can be used to guide the approach taken to perform the detailed data analysis.
When exploring data, analysts use data mining to identify information or patterns that require further investigation. Data scientists use a host of data discovery and profiling tools to mine data. They use statistical parameters and visualizations to determine data quality. For example, histograms can be used to understand the distribution of values across variables. Feedback loops are used to allow for adjustments to be made about what techniques and models best fit the data. Ongoing collaboration between the data scientist and the business analysis practitioner pairs the industry and business domain knowledge possessed by the business analyst practitioner with the analysis results produced by the data scientist to determine whether the results are helping to answer the business question.
| An Example of Exploratory Data Analysis and its Benefits Exploratory data analysis is a systematic and iterative approach used for:
When the data was explored, some of the observations for house prices were found to be outliers when compared to most house prices. Although the data exists, it may influence the final predictions hence the data scientist would have to determine whether to exclude the data or not. An analyst can help in this situation by assessing the data collection method to identify if there are any missed business rules. It was found these observations are artificially set to a high value of $50,000 to signify observations where the prices cannot be disclosed. This analysis supports the data scientists remark that some values are outliers and should be excluded from future analysis. The outliers can be graphically seen below around the $50,000 mark. 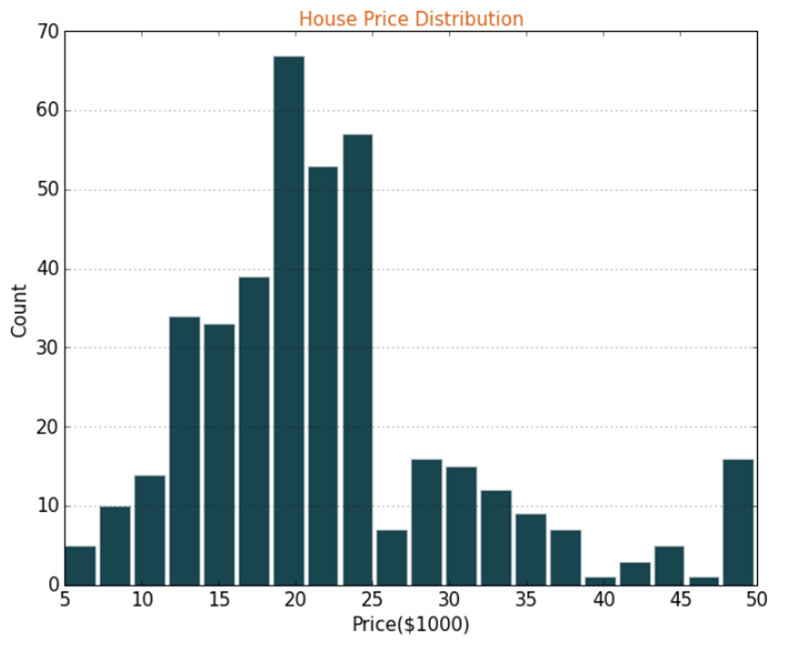 Likewise, when some of the variables are compared against the prices, it was observed that most predictors have a linear relationship with price. For example, some change in the predictor variable changes the price by a proportional amount and has a straight-line relationship, as illustrated below. 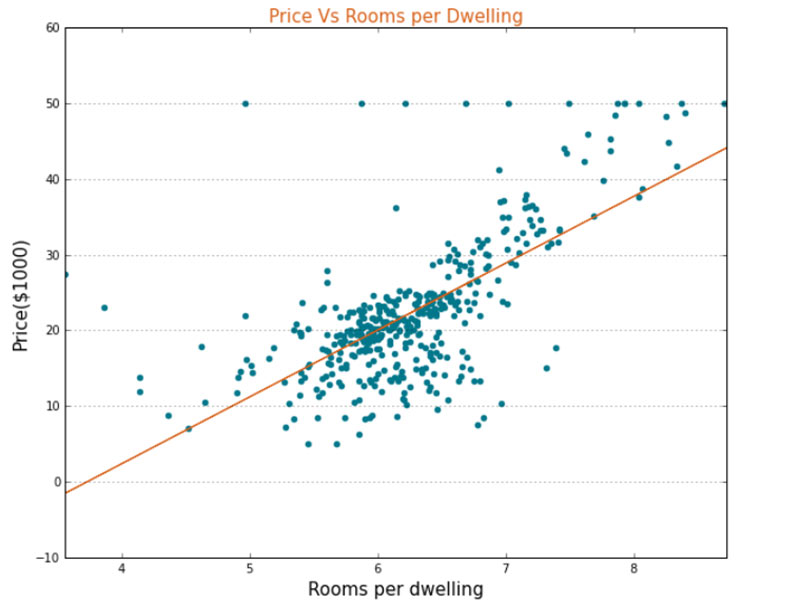 This indicates that a linear model such as Ordinary least squares regression can be used for predicting house prices as a candidate prediction model. In summary, analyst and data scientists can use the outcome of exploratory data analysis to make critical decisions with respect to data quality and modelling approach. The analysts can also use the visuals from the data exploration phase to explain and justify a course of action taken in an analytics exercise. |