
2.5 Tasks
2.5.5 A Case Study for Use Results to Influence Business Decision-Making
Guide to Business Data Analytics
The UK giftware and online gifting industry has gone through unprecedented changes in recent years. Retailers in this industry are experiencing cost pressures and need to increase effective marketing practices in the crowded and historically seasonal marketplace. To differentiate in this highly competitive environment, several top retailers are investing in more customized gift offerings that are personalized for newer target market segments.
.1 The Challenge
The giftware industry regularly transitions through seasonal high-demand and low-demand cycles throughout the calendar year, attributed to various influencing factors. Special occasions such as birthdays, family events (such as engagements, graduations, or weddings), and corporate events are a continuous source of revenue for the giftware industry. However, the major revenue has always been from holiday seasons like Christmas.
GiftRonline is a UK-based and registered non-store online retail company. The company mainly sells unique all-occasion gifts. Considering these aspects, GiftRonline has determined that new market segments are needed for accurate targeting than the traditional demographic segments that they have used in the past. GiftRonline has provided transactional sales data for a year to their data science team to evaluate the possibility of new segments. The data consisted of invoice details such as stock code, product description, customer identifier, unit price, ordered quantity, and delivery country of each invoice or online purchase for a year.
The data science team debated the best analytics approach to use based on the large data set they received. They considered several approaches for segmentation, including value-based segmentation, recency-frequency- monetary analysis (RFM), and psychographic segmentation. After considerable time and effort and with the help of David Brown, a business analysis professional on their team, they settled on the approach to use.
.2 Analytics Approach
The team decided to:
GiftsRonline executives were satisfied with the collaboration and communication between the business and the analytics team but were confused about how best to proceed. In particular, they were unsure about how to leverage this data to meet their original objectives. They had the following key questions:
Additional analysis was completed as David determined how best to communicate this data, and the analytics team was asked to create some key visualizations.
.5 Key Takeaways
.1 The Challenge
The giftware industry regularly transitions through seasonal high-demand and low-demand cycles throughout the calendar year, attributed to various influencing factors. Special occasions such as birthdays, family events (such as engagements, graduations, or weddings), and corporate events are a continuous source of revenue for the giftware industry. However, the major revenue has always been from holiday seasons like Christmas.
GiftRonline is a UK-based and registered non-store online retail company. The company mainly sells unique all-occasion gifts. Considering these aspects, GiftRonline has determined that new market segments are needed for accurate targeting than the traditional demographic segments that they have used in the past. GiftRonline has provided transactional sales data for a year to their data science team to evaluate the possibility of new segments. The data consisted of invoice details such as stock code, product description, customer identifier, unit price, ordered quantity, and delivery country of each invoice or online purchase for a year.
The data science team debated the best analytics approach to use based on the large data set they received. They considered several approaches for segmentation, including value-based segmentation, recency-frequency- monetary analysis (RFM), and psychographic segmentation. After considerable time and effort and with the help of David Brown, a business analysis professional on their team, they settled on the approach to use.
.2 Analytics Approach
The team decided to:
- review product descriptions and group them into specific product baskets,
- resolve overlapping products into single product baskets, and
- cluster customers based on their propensity to buy specific product groups or basket value’
- Five product groupings or categories were identified, and customers were segregated into eleven clusters based on these product categories.
- New customers could be classified into the right cluster with almost (75%) accuracy using an optimized clustering model.
GiftsRonline executives were satisfied with the collaboration and communication between the business and the analytics team but were confused about how best to proceed. In particular, they were unsure about how to leverage this data to meet their original objectives. They had the following key questions:
- What are the product and customer segments and how best to describe their characteristics? Future marketing strategies will revolve around deeper understanding of these segments. The current groupings simply label the segments as cluster no.0, cluster no.1, and so forth.
- How do we operationalize results into the current business? For example, based on these categories are there any recommendations that stand out?
Additional analysis was completed as David determined how best to communicate this data, and the analytics team was asked to create some key visualizations.
- The team produced a word cloud to demonstrate new product category identifiers.
Keywords were extracted from product descriptions within a category: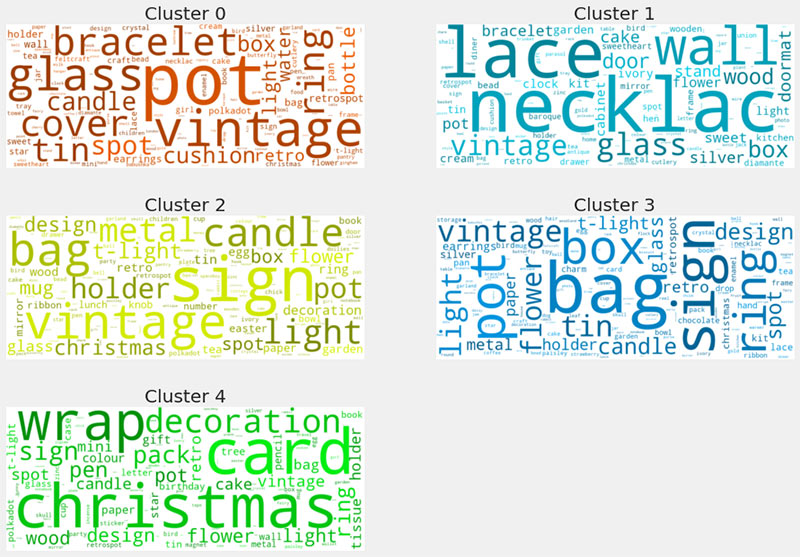
David used the word cloud to highlight and recommend easily understandable cluster names to best describe the product categories. For example, cluster no.2 contains products associated with “Holiday crafts” and cluster no.4 was renamed “Jewelry & Luxury”.
The team then cross-referenced product categories with item values and delivery information for a more refined description of each product category. These were used to help key stakeholders understand product and customer segments. - The team produced spider chart visualizations to clearly differentiate segments.
This chart described each customer segment with individual axes as categories and included attributes such as count (number of purchase visits), mean (average price paid per order), and sum (average spend per customer):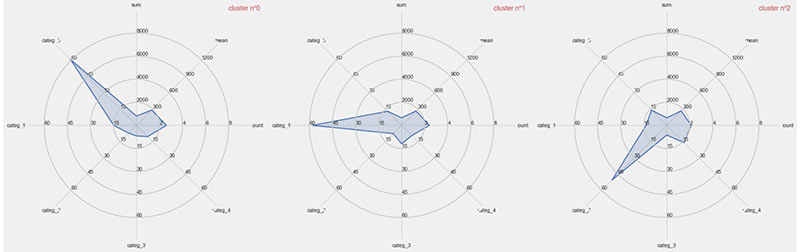
Note: for simplicity, this diagram only depicts the first three categories out of 11.
From the visual, it could be clearly deduced that each customer segment has a distinct propensity towards a product group, which validated the findings and the analytical approach. - To operationalize these findings, David conducted a feasibility study to integrate the analytics finding with the GiftRonline CRM application and provided recommendation aligned to the new marketing segments.
.5 Key Takeaways
- Data insights can influence business decisions, but those insights need to be effectively communicated. The starting point is to develop a shared understanding of analytics results and insights from those results. By leveraging business analysis techniques, the analytics team was able to:
- Effectively communicate the outcomes of the analytics work.
- Develop a shared understanding of what the data was demonstrating.
- Use their insights to influence decision-making.